Subsaharan African vs White/Caucasian Unemployment Among Ages 55 to 59 years
COMPARE
Subsaharan African
White/Caucasian
Unemployment Among Ages 55 to 59 years
Unemployment Among Ages 55 to 59 years Comparison
Sub-Saharan Africans
Whites/Caucasians
5.0%
UNEMPLOYMENT AMONG AGES 55 TO 59 YEARS
4.4/ 100
METRIC RATING
224th/ 347
METRIC RANK
4.7%
UNEMPLOYMENT AMONG AGES 55 TO 59 YEARS
90.7/ 100
METRIC RATING
119th/ 347
METRIC RANK
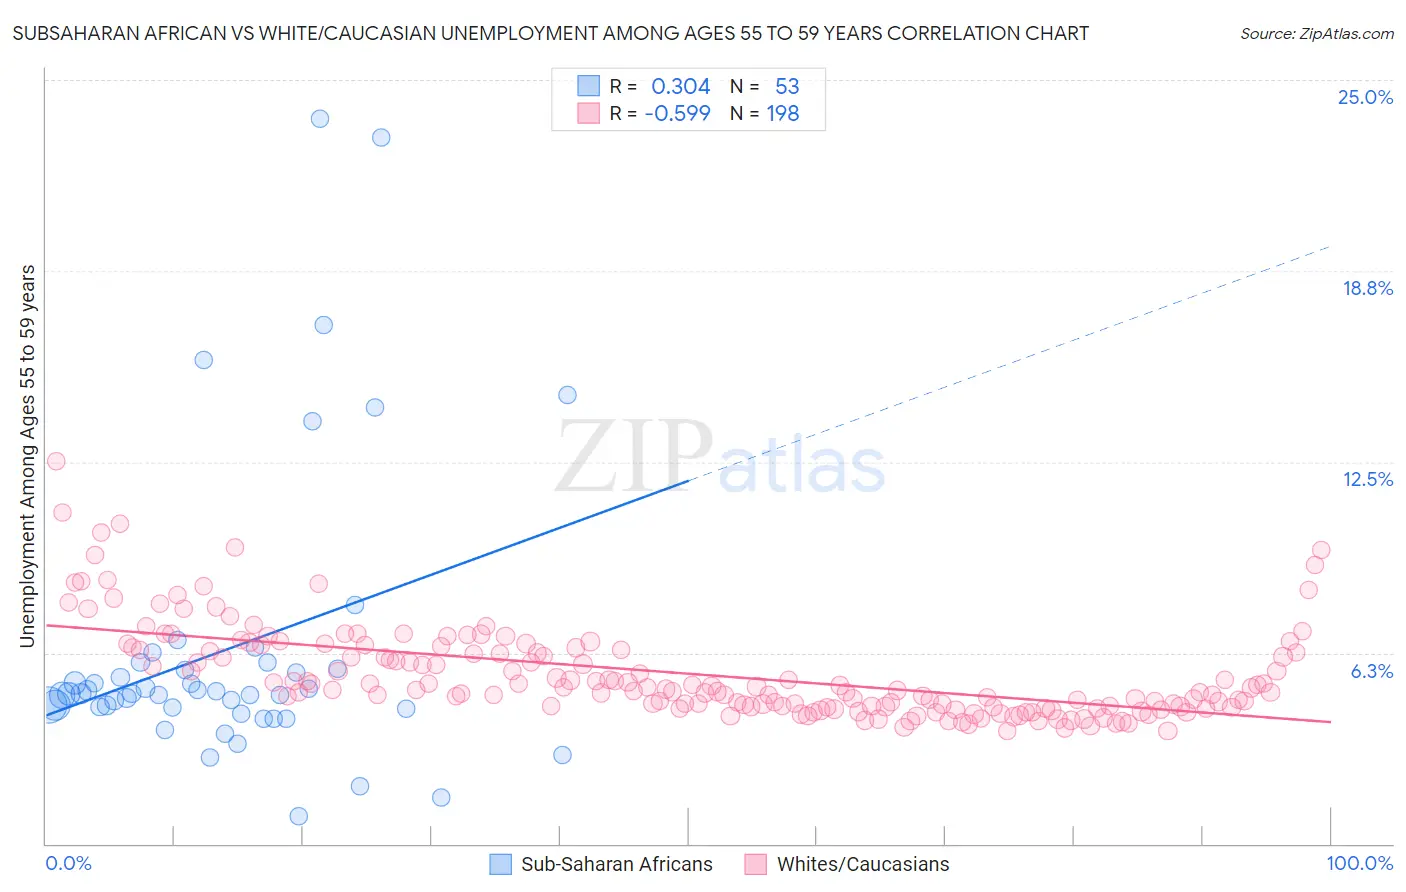
Subsaharan African vs White/Caucasian Unemployment Among Ages 55 to 59 years Correlation Chart
The statistical analysis conducted on geographies consisting of 455,758,057 people shows a mild positive correlation between the proportion of Sub-Saharan Africans and unemployment rate among population between the ages 55 and 59 in the United States with a correlation coefficient (R) of 0.304 and weighted average of 5.0%. Similarly, the statistical analysis conducted on geographies consisting of 492,133,782 people shows a substantial negative correlation between the proportion of Whites/Caucasians and unemployment rate among population between the ages 55 and 59 in the United States with a correlation coefficient (R) of -0.599 and weighted average of 4.7%, a difference of 5.6%.
Unemployment Among Ages 55 to 59 years Correlation Summary
| Measurement | Subsaharan African | White/Caucasian |
| Minimum | 0.90% | 3.7% |
| Maximum | 23.7% | 12.5% |
| Range | 22.8% | 8.8% |
| Mean | 6.4% | 5.6% |
| Median | 4.9% | 5.1% |
| Interquartile 25% (IQ1) | 4.4% | 4.5% |
| Interquartile 75% (IQ3) | 5.8% | 6.3% |
| Interquartile Range (IQR) | 1.4% | 1.9% |
| Standard Deviation (Sample) | 4.8% | 1.5% |
| Standard Deviation (Population) | 4.7% | 1.5% |
Similar Demographics by Unemployment Among Ages 55 to 59 years
Demographics Similar to Sub-Saharan Africans by Unemployment Among Ages 55 to 59 years
In terms of unemployment among ages 55 to 59 years, the demographic groups most similar to Sub-Saharan Africans are Costa Rican (5.0%, a difference of 0.010%), Immigrants from China (5.0%, a difference of 0.060%), Immigrants from Ireland (5.0%, a difference of 0.070%), Spanish (5.0%, a difference of 0.14%), and Immigrants from Iran (5.0%, a difference of 0.19%).
| Demographics | Rating | Rank | Unemployment Among Ages 55 to 59 years |
| Immigrants | Brazil | 8.1 /100 | #217 | Tragic 4.9% |
| Immigrants | Austria | 8.0 /100 | #218 | Tragic 4.9% |
| Immigrants | Nigeria | 8.0 /100 | #219 | Tragic 4.9% |
| Indians (Asian) | 7.6 /100 | #220 | Tragic 4.9% |
| Nigerians | 7.5 /100 | #221 | Tragic 4.9% |
| Spanish | 5.1 /100 | #222 | Tragic 5.0% |
| Immigrants | Ireland | 4.8 /100 | #223 | Tragic 5.0% |
| Sub-Saharan Africans | 4.4 /100 | #224 | Tragic 5.0% |
| Costa Ricans | 4.4 /100 | #225 | Tragic 5.0% |
| Immigrants | China | 4.2 /100 | #226 | Tragic 5.0% |
| Immigrants | Iran | 3.7 /100 | #227 | Tragic 5.0% |
| Immigrants | Liberia | 3.2 /100 | #228 | Tragic 5.0% |
| Immigrants | Western Asia | 3.0 /100 | #229 | Tragic 5.0% |
| Immigrants | Syria | 2.7 /100 | #230 | Tragic 5.0% |
| Cherokee | 2.6 /100 | #231 | Tragic 5.0% |
Demographics Similar to Whites/Caucasians by Unemployment Among Ages 55 to 59 years
In terms of unemployment among ages 55 to 59 years, the demographic groups most similar to Whites/Caucasians are Immigrants from Chile (4.7%, a difference of 0.0%), Turkish (4.7%, a difference of 0.020%), Asian (4.7%, a difference of 0.020%), South American Indian (4.7%, a difference of 0.030%), and Bangladeshi (4.7%, a difference of 0.080%).
| Demographics | Rating | Rank | Unemployment Among Ages 55 to 59 years |
| Afghans | 92.1 /100 | #112 | Exceptional 4.7% |
| Immigrants | Spain | 91.4 /100 | #113 | Exceptional 4.7% |
| Bangladeshis | 91.3 /100 | #114 | Exceptional 4.7% |
| South American Indians | 90.9 /100 | #115 | Exceptional 4.7% |
| Turks | 90.9 /100 | #116 | Exceptional 4.7% |
| Asians | 90.8 /100 | #117 | Exceptional 4.7% |
| Immigrants | Chile | 90.7 /100 | #118 | Exceptional 4.7% |
| Whites/Caucasians | 90.7 /100 | #119 | Exceptional 4.7% |
| Immigrants | South Africa | 89.9 /100 | #120 | Excellent 4.7% |
| Pakistanis | 89.7 /100 | #121 | Excellent 4.7% |
| Immigrants | Afghanistan | 89.5 /100 | #122 | Excellent 4.7% |
| Immigrants | Japan | 89.4 /100 | #123 | Excellent 4.7% |
| Lithuanians | 88.8 /100 | #124 | Excellent 4.7% |
| Immigrants | Malaysia | 87.9 /100 | #125 | Excellent 4.7% |
| Immigrants | Serbia | 87.8 /100 | #126 | Excellent 4.7% |