Subsaharan African vs Guamanian/Chamorro Unemployment Among Ages 55 to 59 years
COMPARE
Subsaharan African
Guamanian/Chamorro
Unemployment Among Ages 55 to 59 years
Unemployment Among Ages 55 to 59 years Comparison
Sub-Saharan Africans
Guamanians/Chamorros
5.0%
UNEMPLOYMENT AMONG AGES 55 TO 59 YEARS
4.4/ 100
METRIC RATING
224th/ 347
METRIC RANK
4.9%
UNEMPLOYMENT AMONG AGES 55 TO 59 YEARS
20.8/ 100
METRIC RATING
203rd/ 347
METRIC RANK
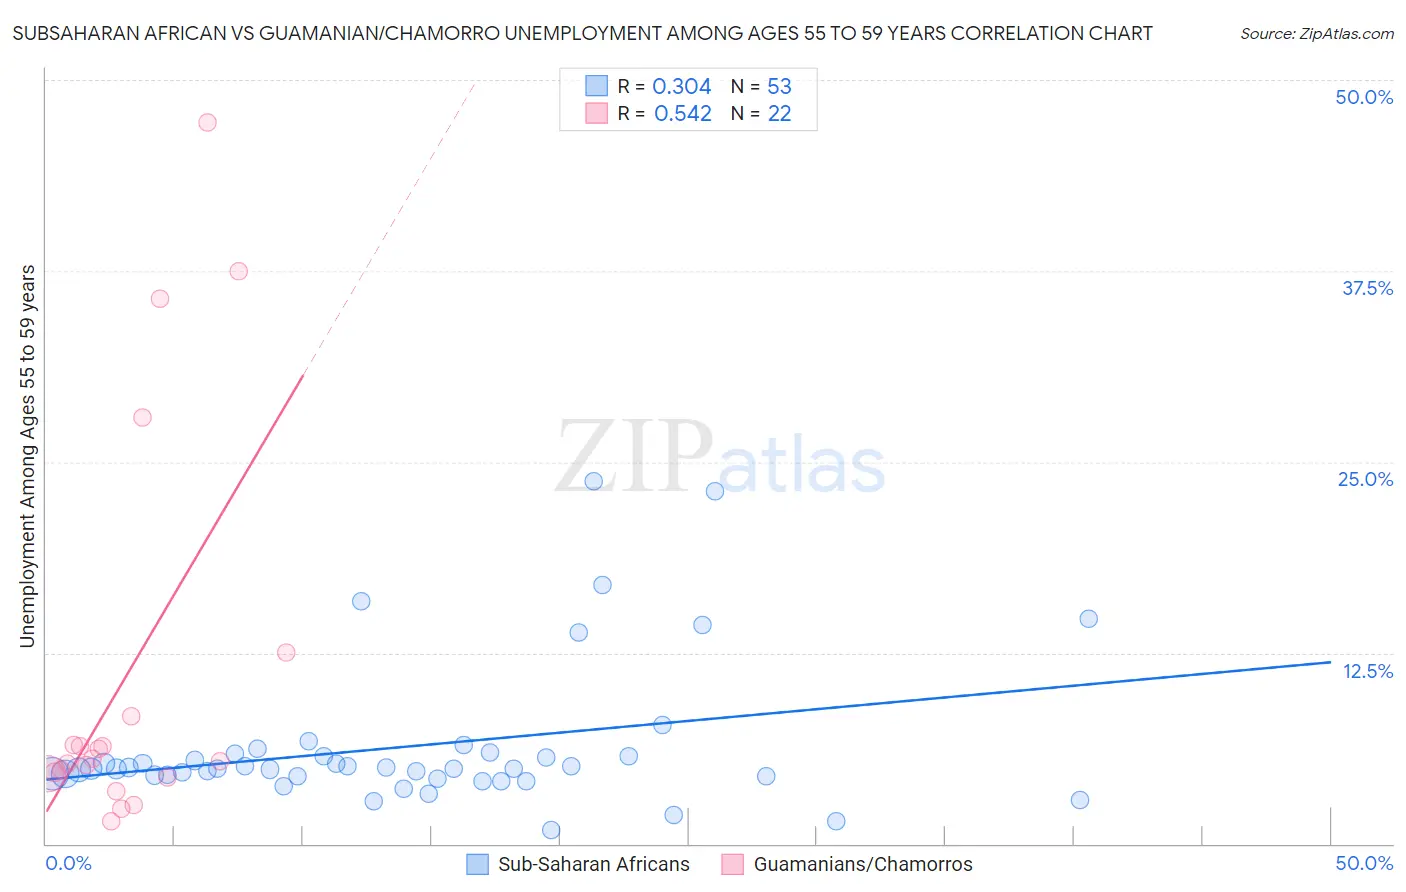
Subsaharan African vs Guamanian/Chamorro Unemployment Among Ages 55 to 59 years Correlation Chart
The statistical analysis conducted on geographies consisting of 455,758,057 people shows a mild positive correlation between the proportion of Sub-Saharan Africans and unemployment rate among population between the ages 55 and 59 in the United States with a correlation coefficient (R) of 0.304 and weighted average of 5.0%. Similarly, the statistical analysis conducted on geographies consisting of 213,051,603 people shows a substantial positive correlation between the proportion of Guamanians/Chamorros and unemployment rate among population between the ages 55 and 59 in the United States with a correlation coefficient (R) of 0.542 and weighted average of 4.9%, a difference of 1.7%.
Unemployment Among Ages 55 to 59 years Correlation Summary
| Measurement | Subsaharan African | Guamanian/Chamorro |
| Minimum | 0.90% | 1.5% |
| Maximum | 23.7% | 47.3% |
| Range | 22.8% | 45.7% |
| Mean | 6.4% | 11.1% |
| Median | 4.9% | 5.5% |
| Interquartile 25% (IQ1) | 4.4% | 4.6% |
| Interquartile 75% (IQ3) | 5.8% | 8.3% |
| Interquartile Range (IQR) | 1.4% | 3.7% |
| Standard Deviation (Sample) | 4.8% | 13.1% |
| Standard Deviation (Population) | 4.7% | 12.8% |
Similar Demographics by Unemployment Among Ages 55 to 59 years
Demographics Similar to Sub-Saharan Africans by Unemployment Among Ages 55 to 59 years
In terms of unemployment among ages 55 to 59 years, the demographic groups most similar to Sub-Saharan Africans are Costa Rican (5.0%, a difference of 0.010%), Immigrants from China (5.0%, a difference of 0.060%), Immigrants from Ireland (5.0%, a difference of 0.070%), Spanish (5.0%, a difference of 0.14%), and Immigrants from Iran (5.0%, a difference of 0.19%).
| Demographics | Rating | Rank | Unemployment Among Ages 55 to 59 years |
| Immigrants | Brazil | 8.1 /100 | #217 | Tragic 4.9% |
| Immigrants | Austria | 8.0 /100 | #218 | Tragic 4.9% |
| Immigrants | Nigeria | 8.0 /100 | #219 | Tragic 4.9% |
| Indians (Asian) | 7.6 /100 | #220 | Tragic 4.9% |
| Nigerians | 7.5 /100 | #221 | Tragic 4.9% |
| Spanish | 5.1 /100 | #222 | Tragic 5.0% |
| Immigrants | Ireland | 4.8 /100 | #223 | Tragic 5.0% |
| Sub-Saharan Africans | 4.4 /100 | #224 | Tragic 5.0% |
| Costa Ricans | 4.4 /100 | #225 | Tragic 5.0% |
| Immigrants | China | 4.2 /100 | #226 | Tragic 5.0% |
| Immigrants | Iran | 3.7 /100 | #227 | Tragic 5.0% |
| Immigrants | Liberia | 3.2 /100 | #228 | Tragic 5.0% |
| Immigrants | Western Asia | 3.0 /100 | #229 | Tragic 5.0% |
| Immigrants | Syria | 2.7 /100 | #230 | Tragic 5.0% |
| Cherokee | 2.6 /100 | #231 | Tragic 5.0% |
Demographics Similar to Guamanians/Chamorros by Unemployment Among Ages 55 to 59 years
In terms of unemployment among ages 55 to 59 years, the demographic groups most similar to Guamanians/Chamorros are Lumbee (4.9%, a difference of 0.10%), Immigrants from South America (4.9%, a difference of 0.13%), Basque (4.9%, a difference of 0.15%), Immigrants from Latvia (4.9%, a difference of 0.15%), and Immigrants from Russia (4.9%, a difference of 0.17%).
| Demographics | Rating | Rank | Unemployment Among Ages 55 to 59 years |
| Eastern Europeans | 26.7 /100 | #196 | Fair 4.9% |
| Macedonians | 26.4 /100 | #197 | Fair 4.9% |
| Immigrants | Philippines | 26.1 /100 | #198 | Fair 4.9% |
| Immigrants | Russia | 23.7 /100 | #199 | Fair 4.9% |
| Basques | 23.3 /100 | #200 | Fair 4.9% |
| Immigrants | South America | 23.1 /100 | #201 | Fair 4.9% |
| Lumbee | 22.5 /100 | #202 | Fair 4.9% |
| Guamanians/Chamorros | 20.8 /100 | #203 | Fair 4.9% |
| Immigrants | Latvia | 18.5 /100 | #204 | Poor 4.9% |
| Haitians | 18.1 /100 | #205 | Poor 4.9% |
| Immigrants | Belarus | 14.1 /100 | #206 | Poor 4.9% |
| Immigrants | Australia | 14.1 /100 | #207 | Poor 4.9% |
| Immigrants | Kazakhstan | 14.0 /100 | #208 | Poor 4.9% |
| Immigrants | Haiti | 13.3 /100 | #209 | Poor 4.9% |
| Creek | 12.9 /100 | #210 | Poor 4.9% |