Subsaharan African vs German Unemployment Among Seniors over 65 years
COMPARE
Subsaharan African
German
Unemployment Among Seniors over 65 years
Unemployment Among Seniors over 65 years Comparison
Sub-Saharan Africans
Germans
5.2%
UNEMPLOYMENT AMONG SENIORS OVER 65 YEARS
17.1/ 100
METRIC RATING
203rd/ 347
METRIC RANK
4.9%
UNEMPLOYMENT AMONG SENIORS OVER 65 YEARS
99.9/ 100
METRIC RATING
47th/ 347
METRIC RANK
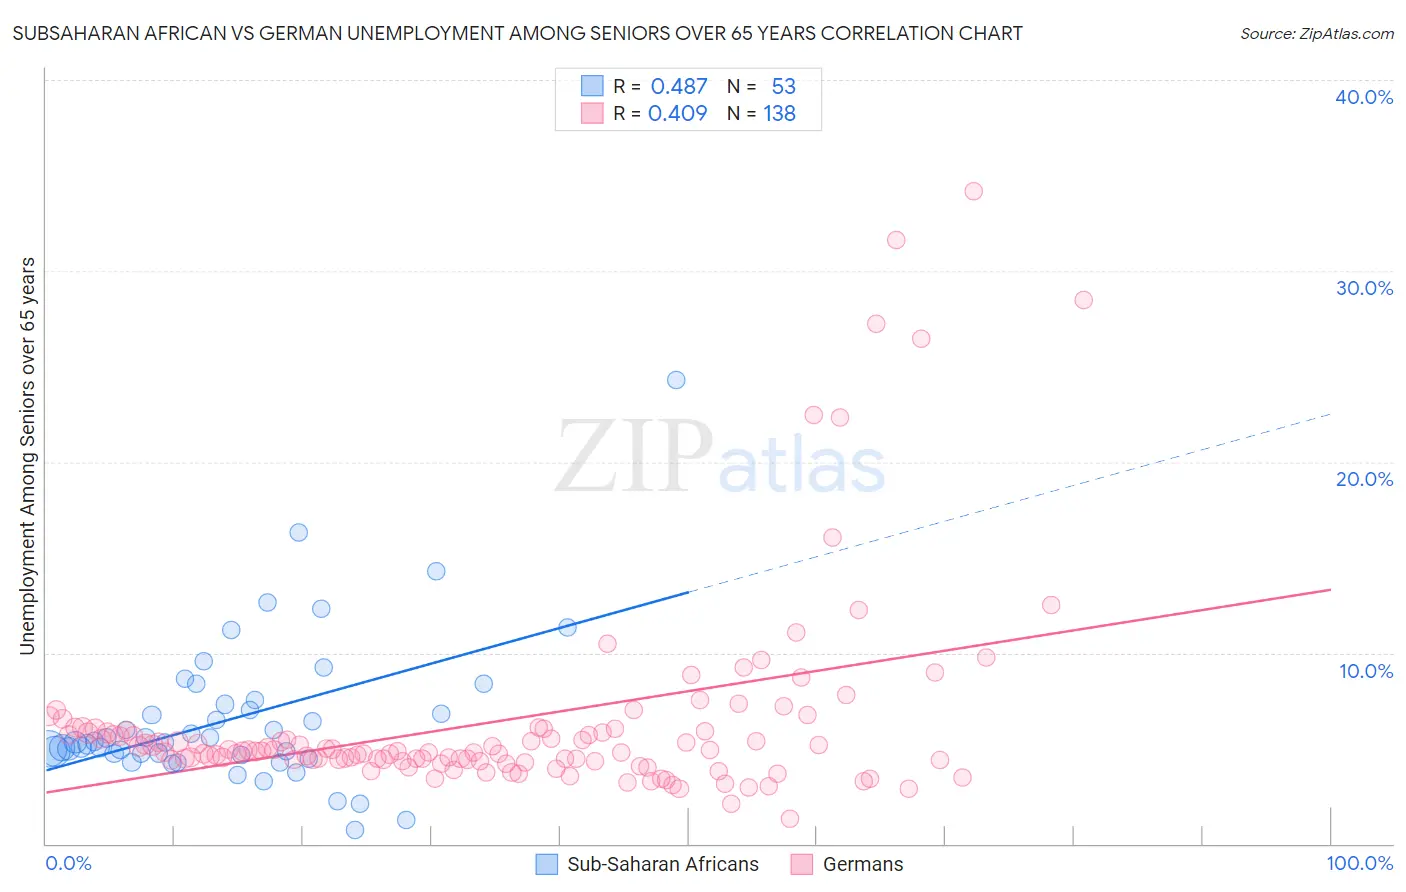
Subsaharan African vs German Unemployment Among Seniors over 65 years Correlation Chart
The statistical analysis conducted on geographies consisting of 436,089,734 people shows a moderate positive correlation between the proportion of Sub-Saharan Africans and unemployment rate amomg seniors over the age of 65 in the United States with a correlation coefficient (R) of 0.487 and weighted average of 5.2%. Similarly, the statistical analysis conducted on geographies consisting of 464,259,353 people shows a moderate positive correlation between the proportion of Germans and unemployment rate amomg seniors over the age of 65 in the United States with a correlation coefficient (R) of 0.409 and weighted average of 4.9%, a difference of 7.2%.
Unemployment Among Seniors over 65 years Correlation Summary
| Measurement | Subsaharan African | German |
| Minimum | 0.70% | 1.3% |
| Maximum | 24.3% | 34.2% |
| Range | 23.6% | 32.9% |
| Mean | 6.5% | 6.4% |
| Median | 5.3% | 4.9% |
| Interquartile 25% (IQ1) | 4.7% | 4.4% |
| Interquartile 75% (IQ3) | 7.4% | 5.9% |
| Interquartile Range (IQR) | 2.7% | 1.5% |
| Standard Deviation (Sample) | 4.0% | 5.4% |
| Standard Deviation (Population) | 3.9% | 5.4% |
Similar Demographics by Unemployment Among Seniors over 65 years
Demographics Similar to Sub-Saharan Africans by Unemployment Among Seniors over 65 years
In terms of unemployment among seniors over 65 years, the demographic groups most similar to Sub-Saharan Africans are Immigrants from China (5.2%, a difference of 0.010%), Immigrants from Northern Africa (5.2%, a difference of 0.030%), Laotian (5.2%, a difference of 0.060%), Immigrants from Pakistan (5.2%, a difference of 0.070%), and Immigrants from Europe (5.2%, a difference of 0.10%).
| Demographics | Rating | Rank | Unemployment Among Seniors over 65 years |
| Immigrants | Poland | 24.3 /100 | #196 | Fair 5.2% |
| Guamanians/Chamorros | 22.5 /100 | #197 | Fair 5.2% |
| Maltese | 19.6 /100 | #198 | Poor 5.2% |
| Immigrants | Europe | 19.0 /100 | #199 | Poor 5.2% |
| Immigrants | Pakistan | 18.4 /100 | #200 | Poor 5.2% |
| Laotians | 18.1 /100 | #201 | Poor 5.2% |
| Immigrants | Northern Africa | 17.7 /100 | #202 | Poor 5.2% |
| Sub-Saharan Africans | 17.1 /100 | #203 | Poor 5.2% |
| Immigrants | China | 16.9 /100 | #204 | Poor 5.2% |
| South American Indians | 15.3 /100 | #205 | Poor 5.2% |
| German Russians | 14.7 /100 | #206 | Poor 5.2% |
| Immigrants | Philippines | 13.2 /100 | #207 | Poor 5.2% |
| Uruguayans | 12.6 /100 | #208 | Poor 5.2% |
| Alsatians | 11.4 /100 | #209 | Poor 5.2% |
| Immigrants | Uzbekistan | 10.7 /100 | #210 | Poor 5.2% |
Demographics Similar to Germans by Unemployment Among Seniors over 65 years
In terms of unemployment among seniors over 65 years, the demographic groups most similar to Germans are Choctaw (4.9%, a difference of 0.010%), Immigrants from Jordan (4.9%, a difference of 0.030%), Ethiopian (4.9%, a difference of 0.16%), Jordanian (4.9%, a difference of 0.20%), and Immigrants from Kenya (4.9%, a difference of 0.20%).
| Demographics | Rating | Rank | Unemployment Among Seniors over 65 years |
| Immigrants | Sweden | 99.9 /100 | #40 | Exceptional 4.8% |
| Kiowa | 99.9 /100 | #41 | Exceptional 4.8% |
| Swiss | 99.9 /100 | #42 | Exceptional 4.8% |
| Luxembourgers | 99.9 /100 | #43 | Exceptional 4.8% |
| Jordanians | 99.9 /100 | #44 | Exceptional 4.9% |
| Ethiopians | 99.9 /100 | #45 | Exceptional 4.9% |
| Immigrants | Jordan | 99.9 /100 | #46 | Exceptional 4.9% |
| Germans | 99.9 /100 | #47 | Exceptional 4.9% |
| Choctaw | 99.9 /100 | #48 | Exceptional 4.9% |
| Immigrants | Kenya | 99.9 /100 | #49 | Exceptional 4.9% |
| Immigrants | Austria | 99.9 /100 | #50 | Exceptional 4.9% |
| Scotch-Irish | 99.9 /100 | #51 | Exceptional 4.9% |
| Swedes | 99.9 /100 | #52 | Exceptional 4.9% |
| Immigrants | Sudan | 99.8 /100 | #53 | Exceptional 4.9% |
| Immigrants | Iraq | 99.8 /100 | #54 | Exceptional 4.9% |