Subsaharan African vs Black/African American Unemployment Among Seniors over 65 years

COMPARE

Subsaharan African
Race
Ancestry
AfghanAfricanAlaska NativeAlaskan AthabascanAlbanianAleutAlsatianAmericanApacheArabArapahoArgentineanArmenianAssyrian/Chaldean/SyriacAustralianAustrianBahamianBangladeshiBarbadianBasqueBelgianBelizeanBermudanBhutaneseBlackfeetBolivianBrazilianBritishBritish West IndianBulgarianBurmeseCajunCambodianCanadianCape VerdeanCarpatho RusynCelticCentral AmericanCentral American IndianCherokeeCheyenneChickasawChileanChineseChippewaChoctawColombianColvilleComancheCosta RicanCreeCreekCroatianCrowCubanCypriotCzechCzechoslovakianDanishDelawareDominicanDutchDutch West IndianEastern EuropeanEcuadorianEgyptianEnglishEstonianEthiopianEuropeanFijianFilipinoFinnishFrenchFrench American IndianFrench CanadianGermanGerman RussianGhanaianGreekGuamanian/ChamorroGuatemalanGuyaneseHaitianHmongHonduranHopiHoumaHungarianIcelanderIndian (Asian)IndonesianInupiatIranianIraqiIrishIroquoisIsraeliItalianJamaicanJapaneseJordanianKenyanKiowaKoreanLaotianLatvianLebaneseLiberianLithuanianLumbeeLuxembourgerMacedonianMalaysianMalteseMarshalleseMenomineeMexicanMexican American IndianMongolianMoroccanNative HawaiianNavajoNepaleseNew ZealanderNicaraguanNigerianNorthern EuropeanNorwegianOkinawanOsageOttawaPaiutePakistaniPalestinianPanamanianParaguayanPennsylvania GermanPeruvianPimaPolishPortuguesePotawatomiPuebloPuerto RicanPuget Sound SalishRomanianRussianSalvadoranSamoanScandinavianScotch-IrishScottishSeminoleSenegaleseSerbianShoshoneSierra LeoneanSiouxSlavicSlovakSloveneSomaliSouth AfricanSouth AmericanSouth American IndianSoviet UnionSpaniardSpanishSpanish AmericanSpanish American IndianSri LankanSubsaharan AfricanSudaneseSwedishSwissSyrianTaiwaneseThaiTlingit-HaidaTohono O'OdhamTonganTrinidadian and TobagonianTsimshianTurkishU.S. Virgin IslanderUgandanUkrainianUruguayanUteVenezuelanVietnameseWelshWest IndianYakamaYaquiYugoslavianYumanYup'ikZimbabwean
Immigration
NonimmigrantsImmigrantsAfghanistanAfricaAlbaniaArgentinaArmeniaAsiaAustraliaAustriaBahamasBangladeshBarbadosBelarusBelgiumBelizeBoliviaBosnia and HerzegovinaBrazilBulgariaBurma/MyanmarCabo VerdeCambodiaCameroonCanadaCaribbeanCentral AmericaChileChinaColombiaCongoCosta RicaCroatiaCubaCzechoslovakiaDenmarkDominicaDominican RepublicEastern AfricaEastern AsiaEastern EuropeEcuadorEgyptEl SalvadorEnglandEritreaEthiopiaEuropeFijiFranceGermanyGhanaGreeceGrenadaGuatemalaGuyanaHaitiHondurasHong KongHungaryIndiaIndonesiaIranIraqIrelandIsraelItalyJamaicaJapanJordanKazakhstanKenyaKoreaKuwaitLaosLatin AmericaLatviaLebanonLiberiaLithuaniaMalaysiaMexicoMicronesiaMiddle AfricaMoldovaMoroccoNepalNetherlandsNicaraguaNigeriaNorth AmericaNorth MacedoniaNorthern AfricaNorthern EuropeNorwayOceaniaPakistanPanamaPeruPhilippinesPolandPortugalRomaniaRussiaSaudi ArabiaScotlandSenegalSerbiaSierra LeoneSingaporeSomaliaSouth AfricaSouth AmericaSouth Central AsiaSouth Eastern AsiaSouthern EuropeSpainSri LankaSt. Vincent and the GrenadinesSudanSwedenSwitzerlandSyriaTaiwanThailandTrinidad and TobagoTurkeyUgandaUkraineUruguayUzbekistanVenezuelaVietnamWest IndiesWestern AfricaWestern AsiaWestern EuropeYemenZaireZimbabweAzores
Black/African American
Race
Ancestry
AfghanAfricanAlaska NativeAlaskan AthabascanAlbanianAleutAlsatianAmericanApacheArabArapahoArgentineanArmenianAssyrian/Chaldean/SyriacAustralianAustrianBahamianBangladeshiBarbadianBasqueBelgianBelizeanBermudanBhutaneseBlackfeetBolivianBrazilianBritishBritish West IndianBulgarianBurmeseCajunCambodianCanadianCape VerdeanCarpatho RusynCelticCentral AmericanCentral American IndianCherokeeCheyenneChickasawChileanChineseChippewaChoctawColombianColvilleComancheCosta RicanCreeCreekCroatianCrowCubanCypriotCzechCzechoslovakianDanishDelawareDominicanDutchDutch West IndianEastern EuropeanEcuadorianEgyptianEnglishEstonianEthiopianEuropeanFijianFilipinoFinnishFrenchFrench American IndianFrench CanadianGermanGerman RussianGhanaianGreekGuamanian/ChamorroGuatemalanGuyaneseHaitianHmongHonduranHopiHoumaHungarianIcelanderIndian (Asian)IndonesianInupiatIranianIraqiIrishIroquoisIsraeliItalianJamaicanJapaneseJordanianKenyanKiowaKoreanLaotianLatvianLebaneseLiberianLithuanianLumbeeLuxembourgerMacedonianMalaysianMalteseMarshalleseMenomineeMexicanMexican American IndianMongolianMoroccanNative HawaiianNavajoNepaleseNew ZealanderNicaraguanNigerianNorthern EuropeanNorwegianOkinawanOsageOttawaPaiutePakistaniPalestinianPanamanianParaguayanPennsylvania GermanPeruvianPimaPolishPortuguesePotawatomiPuebloPuerto RicanPuget Sound SalishRomanianRussianSalvadoranSamoanScandinavianScotch-IrishScottishSeminoleSenegaleseSerbianShoshoneSierra LeoneanSiouxSlavicSlovakSloveneSomaliSouth AfricanSouth AmericanSouth American IndianSoviet UnionSpaniardSpanishSpanish AmericanSpanish American IndianSri LankanSudaneseSwedishSwissSyrianTaiwaneseThaiTlingit-HaidaTohono O'OdhamTonganTrinidadian and TobagonianTsimshianTurkishU.S. Virgin IslanderUgandanUkrainianUruguayanUteVenezuelanVietnameseWelshWest IndianYakamaYaquiYugoslavianYumanYup'ikZimbabwean
Immigration
NonimmigrantsImmigrantsAfghanistanAfricaAlbaniaArgentinaArmeniaAsiaAustraliaAustriaBahamasBangladeshBarbadosBelarusBelgiumBelizeBoliviaBosnia and HerzegovinaBrazilBulgariaBurma/MyanmarCabo VerdeCambodiaCameroonCanadaCaribbeanCentral AmericaChileChinaColombiaCongoCosta RicaCroatiaCubaCzechoslovakiaDenmarkDominicaDominican RepublicEastern AfricaEastern AsiaEastern EuropeEcuadorEgyptEl SalvadorEnglandEritreaEthiopiaEuropeFijiFranceGermanyGhanaGreeceGrenadaGuatemalaGuyanaHaitiHondurasHong KongHungaryIndiaIndonesiaIranIraqIrelandIsraelItalyJamaicaJapanJordanKazakhstanKenyaKoreaKuwaitLaosLatin AmericaLatviaLebanonLiberiaLithuaniaMalaysiaMexicoMicronesiaMiddle AfricaMoldovaMoroccoNepalNetherlandsNicaraguaNigeriaNorth AmericaNorth MacedoniaNorthern AfricaNorthern EuropeNorwayOceaniaPakistanPanamaPeruPhilippinesPolandPortugalRomaniaRussiaSaudi ArabiaScotlandSenegalSerbiaSierra LeoneSingaporeSomaliaSouth AfricaSouth AmericaSouth Central AsiaSouth Eastern AsiaSouthern EuropeSpainSri LankaSt. Vincent and the GrenadinesSudanSwedenSwitzerlandSyriaTaiwanThailandTrinidad and TobagoTurkeyUgandaUkraineUruguayUzbekistanVenezuelaVietnamWest IndiesWestern AfricaWestern AsiaWestern EuropeYemenZaireZimbabweAzores
Unemployment Among Seniors over 65 years
Income
Poverty
Unemployment
Labor Participation
Family Structure
Vehicle Availability
Education Level
Disability

Unemployment Among Seniors over 65 years Comparison

Sub-Saharan Africans

Blacks/African Americans

Poor
Tragic
5.2%
UNEMPLOYMENT AMONG SENIORS OVER 65 YEARS
17.1/ 100
METRIC RATING
203rd/ 347
METRIC RANK
5.5%
UNEMPLOYMENT AMONG SENIORS OVER 65 YEARS
0.0/ 100
METRIC RATING
291st/ 347
METRIC RANK

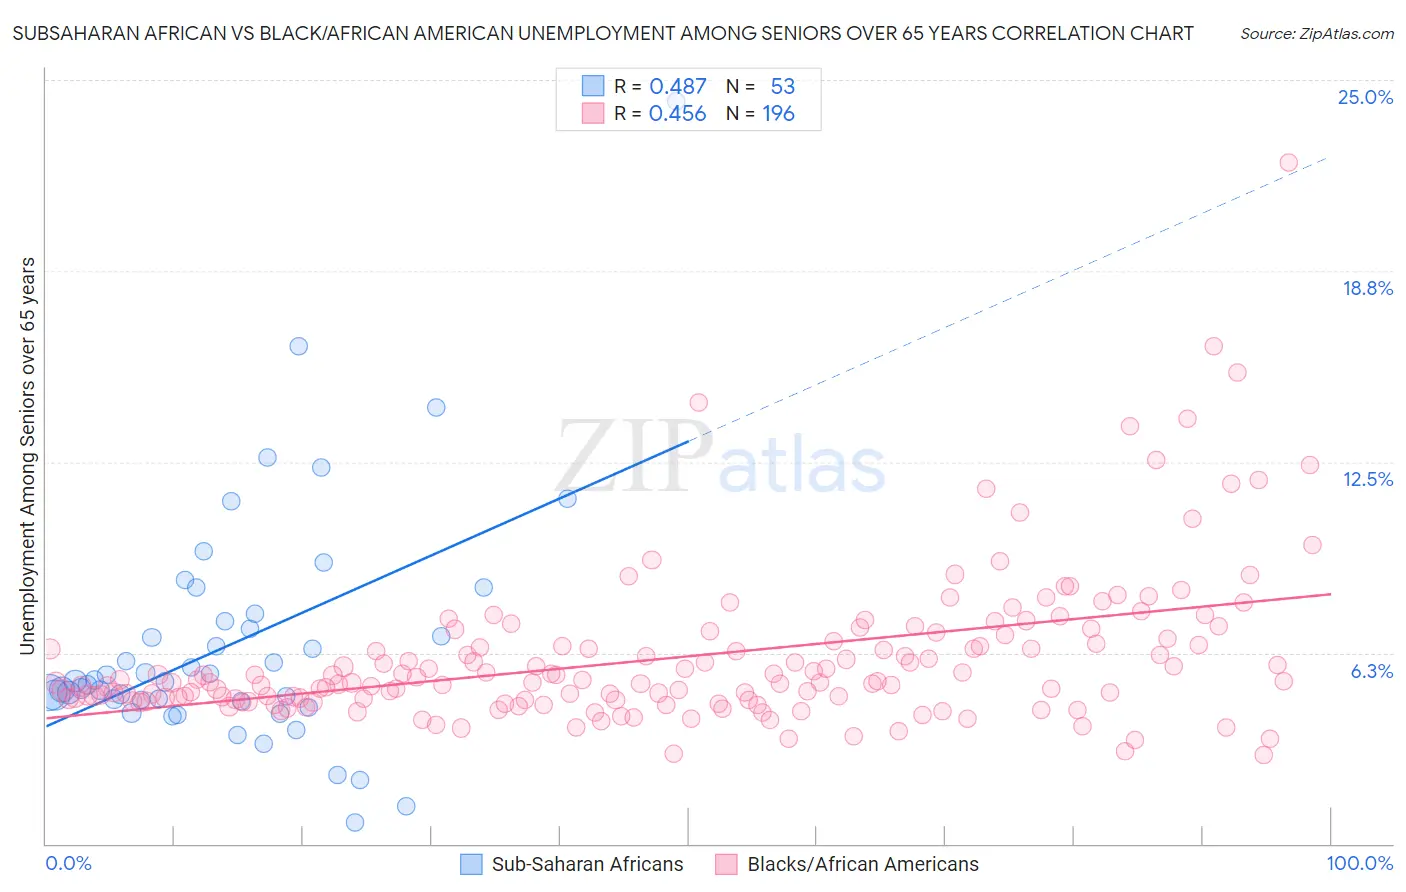
Subsaharan African vs Black/African American Unemployment Among Seniors over 65 years Correlation Chart

The statistical analysis conducted on geographies consisting of 436,089,734 people shows a moderate positive correlation between the proportion of Sub-Saharan Africans and unemployment rate amomg seniors over the age of 65 in the United States with a correlation coefficient (R) of 0.487 and weighted average of 5.2%. Similarly, the statistical analysis conducted on geographies consisting of 461,286,311 people shows a moderate positive correlation between the proportion of Blacks/African Americans and unemployment rate amomg seniors over the age of 65 in the United States with a correlation coefficient (R) of 0.456 and weighted average of 5.5%, a difference of 6.1%.
Subsaharan African vs Black/African American Unemployment Among Seniors over 65 years

Unemployment Among Seniors over 65 years Correlation Summary

MeasurementSubsaharan AfricanBlack/African American
Minimum0.70%2.9%
Maximum24.3%22.3%
Range23.6%19.4%
Mean6.5%6.1%
Median5.3%5.3%
Interquartile 25% (IQ1)4.7%4.7%
Interquartile 75% (IQ3)7.4%6.6%
Interquartile Range (IQR)2.7%1.9%
Standard Deviation (Sample)4.0%2.5%
Standard Deviation (Population)3.9%2.5%

Similar Demographics by Unemployment Among Seniors over 65 years

Demographics Similar to Sub-Saharan Africans by Unemployment Among Seniors over 65 years

In terms of unemployment among seniors over 65 years, the demographic groups most similar to Sub-Saharan Africans are Immigrants from China (5.2%, a difference of 0.010%), Immigrants from Northern Africa (5.2%, a difference of 0.030%), Laotian (5.2%, a difference of 0.060%), Immigrants from Pakistan (5.2%, a difference of 0.070%), and Immigrants from Europe (5.2%, a difference of 0.10%).
DemographicsRating | RankUnemployment Among Seniors over 65 years
Immigrants | Poland
24.3
/100
|
#196
Fair
5.2%
Guamanians/Chamorros
22.5
/100
|
#197
Fair
5.2%
Maltese
19.6
/100
|
#198
Poor
5.2%
Immigrants | Europe
19.0
/100
|
#199
Poor
5.2%
Immigrants | Pakistan
18.4
/100
|
#200
Poor
5.2%
Laotians
18.1
/100
|
#201
Poor
5.2%
Immigrants | Northern Africa
17.7
/100
|
#202
Poor
5.2%
Sub-Saharan Africans
17.1
/100
|
#203
Poor
5.2%
Immigrants | China
16.9
/100
|
#204
Poor
5.2%
South American Indians
15.3
/100
|
#205
Poor
5.2%
German Russians
14.7
/100
|
#206
Poor
5.2%
Immigrants | Philippines
13.2
/100
|
#207
Poor
5.2%
Uruguayans
12.6
/100
|
#208
Poor
5.2%
Alsatians
11.4
/100
|
#209
Poor
5.2%
Immigrants | Uzbekistan
10.7
/100
|
#210
Poor
5.2%

Demographics Similar to Blacks/African Americans by Unemployment Among Seniors over 65 years

In terms of unemployment among seniors over 65 years, the demographic groups most similar to Blacks/African Americans are Jamaican (5.5%, a difference of 0.030%), Belizean (5.5%, a difference of 0.15%), Immigrants from Venezuela (5.5%, a difference of 0.19%), Armenian (5.5%, a difference of 0.23%), and Cheyenne (5.5%, a difference of 0.30%).
DemographicsRating | RankUnemployment Among Seniors over 65 years
Immigrants | Liberia
0.0
/100
|
#284
Tragic
5.5%
Central Americans
0.0
/100
|
#285
Tragic
5.5%
Immigrants | Barbados
0.0
/100
|
#286
Tragic
5.5%
Venezuelans
0.0
/100
|
#287
Tragic
5.5%
U.S. Virgin Islanders
0.0
/100
|
#288
Tragic
5.5%
Immigrants | Cabo Verde
0.0
/100
|
#289
Tragic
5.5%
Jamaicans
0.0
/100
|
#290
Tragic
5.5%
Blacks/African Americans
0.0
/100
|
#291
Tragic
5.5%
Belizeans
0.0
/100
|
#292
Tragic
5.5%
Immigrants | Venezuela
0.0
/100
|
#293
Tragic
5.5%
Armenians
0.0
/100
|
#294
Tragic
5.5%
Cheyenne
0.0
/100
|
#295
Tragic
5.5%
Cape Verdeans
0.0
/100
|
#296
Tragic
5.5%
Yaqui
0.0
/100
|
#297
Tragic
5.5%
Immigrants | West Indies
0.0
/100
|
#298
Tragic
5.6%