South American vs Vietnamese Male Unemployment
COMPARE
South American
Vietnamese
Male Unemployment
Male Unemployment Comparison
South Americans
Vietnamese
5.3%
MALE UNEMPLOYMENT
60.6/ 100
METRIC RATING
165th/ 347
METRIC RANK
6.6%
MALE UNEMPLOYMENT
0.0/ 100
METRIC RATING
300th/ 347
METRIC RANK
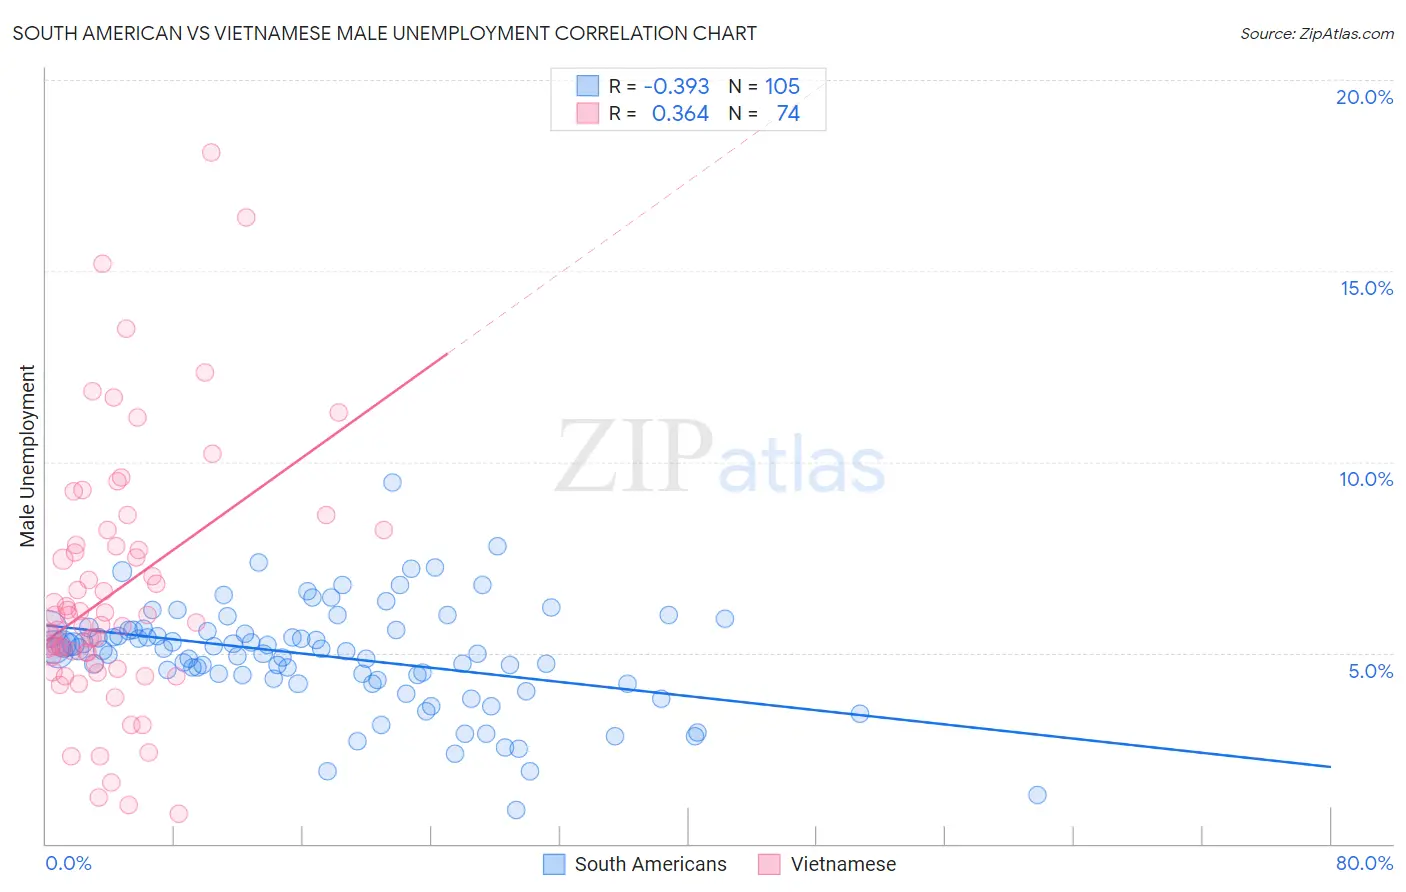
South American vs Vietnamese Male Unemployment Correlation Chart
The statistical analysis conducted on geographies consisting of 490,586,093 people shows a mild negative correlation between the proportion of South Americans and unemployment rate among males in the United States with a correlation coefficient (R) of -0.393 and weighted average of 5.3%. Similarly, the statistical analysis conducted on geographies consisting of 170,612,254 people shows a mild positive correlation between the proportion of Vietnamese and unemployment rate among males in the United States with a correlation coefficient (R) of 0.364 and weighted average of 6.6%, a difference of 25.1%.
Male Unemployment Correlation Summary
| Measurement | South American | Vietnamese |
| Minimum | 0.90% | 0.80% |
| Maximum | 9.5% | 18.1% |
| Range | 8.6% | 17.3% |
| Mean | 4.9% | 6.6% |
| Median | 5.1% | 5.9% |
| Interquartile 25% (IQ1) | 4.3% | 4.7% |
| Interquartile 75% (IQ3) | 5.6% | 7.8% |
| Interquartile Range (IQR) | 1.3% | 3.1% |
| Standard Deviation (Sample) | 1.4% | 3.4% |
| Standard Deviation (Population) | 1.4% | 3.3% |
Similar Demographics by Male Unemployment
Demographics Similar to South Americans by Male Unemployment
In terms of male unemployment, the demographic groups most similar to South Americans are Immigrants from Morocco (5.3%, a difference of 0.030%), Afghan (5.3%, a difference of 0.080%), Immigrants from Vietnam (5.3%, a difference of 0.15%), Immigrants from Ireland (5.3%, a difference of 0.18%), and Immigrants from Congo (5.3%, a difference of 0.20%).
| Demographics | Rating | Rank | Male Unemployment |
| Immigrants | Indonesia | 71.5 /100 | #158 | Good 5.2% |
| Indonesians | 71.2 /100 | #159 | Good 5.2% |
| Immigrants | Norway | 71.0 /100 | #160 | Good 5.2% |
| Immigrants | China | 70.6 /100 | #161 | Good 5.2% |
| Immigrants | Egypt | 65.9 /100 | #162 | Good 5.2% |
| Immigrants | Hong Kong | 65.7 /100 | #163 | Good 5.2% |
| Afghans | 62.0 /100 | #164 | Good 5.3% |
| South Americans | 60.6 /100 | #165 | Good 5.3% |
| Immigrants | Morocco | 60.2 /100 | #166 | Good 5.3% |
| Immigrants | Vietnam | 58.1 /100 | #167 | Average 5.3% |
| Immigrants | Ireland | 57.7 /100 | #168 | Average 5.3% |
| Immigrants | Congo | 57.4 /100 | #169 | Average 5.3% |
| Immigrants | Eastern Europe | 54.1 /100 | #170 | Average 5.3% |
| Peruvians | 51.9 /100 | #171 | Average 5.3% |
| Immigrants | Kazakhstan | 50.8 /100 | #172 | Average 5.3% |
Demographics Similar to Vietnamese by Male Unemployment
In terms of male unemployment, the demographic groups most similar to Vietnamese are Immigrants from Belize (6.6%, a difference of 0.11%), Immigrants from Bangladesh (6.6%, a difference of 0.27%), Jamaican (6.6%, a difference of 0.40%), Chippewa (6.6%, a difference of 0.48%), and Immigrants from Haiti (6.5%, a difference of 0.80%).
| Demographics | Rating | Rank | Male Unemployment |
| Haitians | 0.0 /100 | #293 | Tragic 6.4% |
| Senegalese | 0.0 /100 | #294 | Tragic 6.4% |
| Belizeans | 0.0 /100 | #295 | Tragic 6.5% |
| Immigrants | Haiti | 0.0 /100 | #296 | Tragic 6.5% |
| Chippewa | 0.0 /100 | #297 | Tragic 6.6% |
| Jamaicans | 0.0 /100 | #298 | Tragic 6.6% |
| Immigrants | Bangladesh | 0.0 /100 | #299 | Tragic 6.6% |
| Vietnamese | 0.0 /100 | #300 | Tragic 6.6% |
| Immigrants | Belize | 0.0 /100 | #301 | Tragic 6.6% |
| Ute | 0.0 /100 | #302 | Tragic 6.6% |
| Immigrants | West Indies | 0.0 /100 | #303 | Tragic 6.7% |
| West Indians | 0.0 /100 | #304 | Tragic 6.7% |
| Trinidadians and Tobagonians | 0.0 /100 | #305 | Tragic 6.7% |
| Immigrants | Trinidad and Tobago | 0.0 /100 | #306 | Tragic 6.7% |
| Immigrants | Jamaica | 0.0 /100 | #307 | Tragic 6.7% |