South American vs Vietnamese Births to Unmarried Women
COMPARE
South American
Vietnamese
Births to Unmarried Women
Births to Unmarried Women Comparison
South Americans
Vietnamese
31.8%
BIRTHS TO UNMARRIED WOMEN
46.9/ 100
METRIC RATING
179th/ 347
METRIC RANK
30.2%
BIRTHS TO UNMARRIED WOMEN
87.7/ 100
METRIC RATING
125th/ 347
METRIC RANK
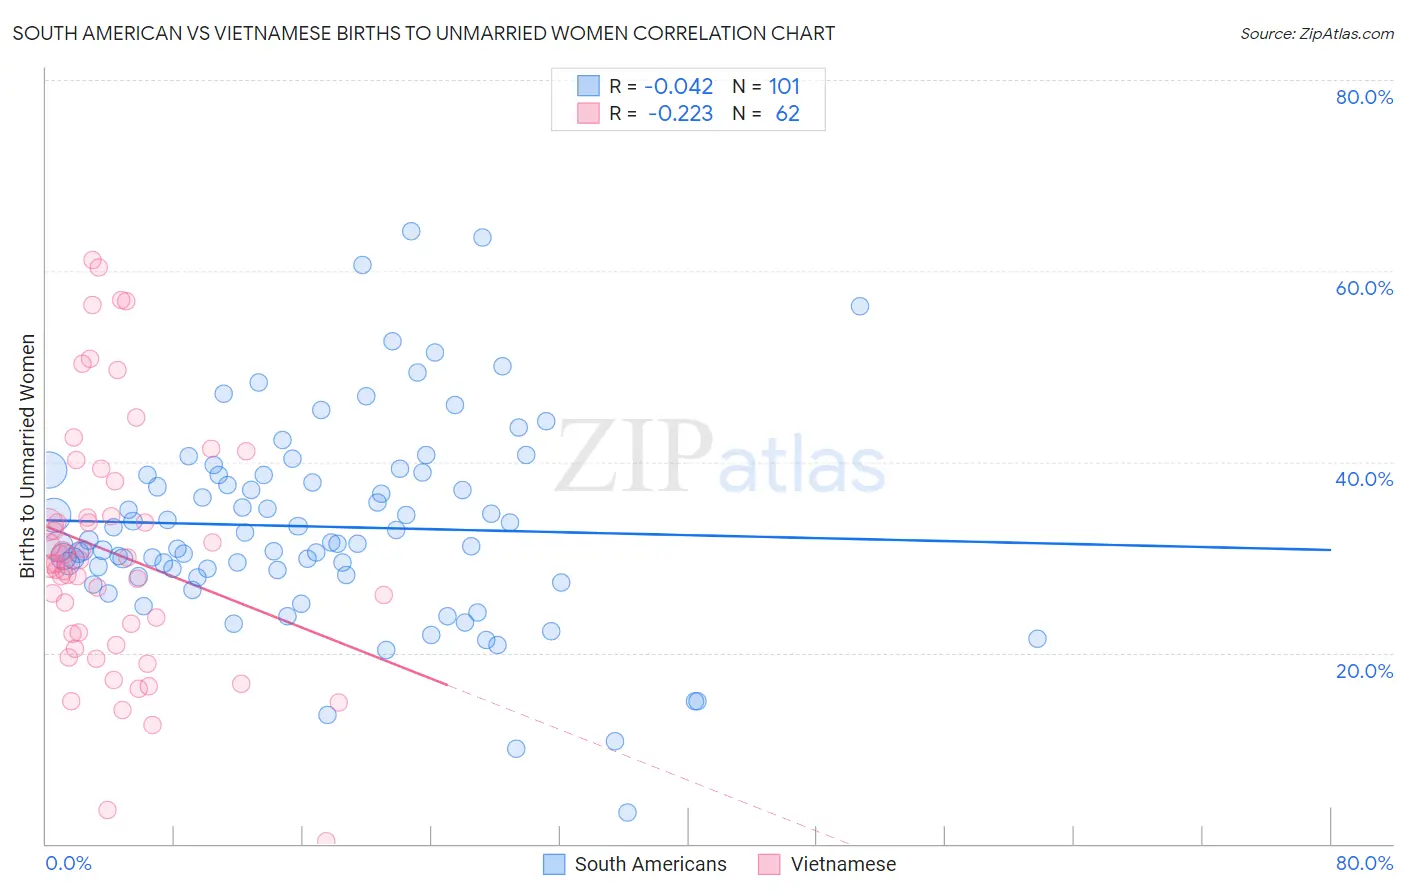
South American vs Vietnamese Births to Unmarried Women Correlation Chart
The statistical analysis conducted on geographies consisting of 453,273,993 people shows no correlation between the proportion of South Americans and percentage of births to unmarried women in the United States with a correlation coefficient (R) of -0.042 and weighted average of 31.8%. Similarly, the statistical analysis conducted on geographies consisting of 164,695,989 people shows a weak negative correlation between the proportion of Vietnamese and percentage of births to unmarried women in the United States with a correlation coefficient (R) of -0.223 and weighted average of 30.2%, a difference of 5.2%.
Births to Unmarried Women Correlation Summary
| Measurement | South American | Vietnamese |
| Minimum | 3.3% | 0.20% |
| Maximum | 64.1% | 61.1% |
| Range | 60.8% | 60.9% |
| Mean | 33.2% | 30.5% |
| Median | 31.4% | 29.3% |
| Interquartile 25% (IQ1) | 28.1% | 22.0% |
| Interquartile 75% (IQ3) | 38.7% | 34.3% |
| Interquartile Range (IQR) | 10.6% | 12.3% |
| Standard Deviation (Sample) | 10.6% | 13.0% |
| Standard Deviation (Population) | 10.5% | 12.9% |
Similar Demographics by Births to Unmarried Women
Demographics Similar to South Americans by Births to Unmarried Women
In terms of births to unmarried women, the demographic groups most similar to South Americans are English (31.7%, a difference of 0.040%), South American Indian (31.7%, a difference of 0.070%), Scottish (31.7%, a difference of 0.11%), Moroccan (31.8%, a difference of 0.11%), and Immigrants from Peru (31.8%, a difference of 0.18%).
| Demographics | Rating | Rank | Births to Unmarried Women |
| Immigrants | Eritrea | 50.4 /100 | #172 | Average 31.7% |
| Immigrants | Yemen | 50.2 /100 | #173 | Average 31.7% |
| Venezuelans | 50.0 /100 | #174 | Average 31.7% |
| Immigrants | Venezuela | 49.2 /100 | #175 | Average 31.7% |
| Scottish | 48.1 /100 | #176 | Average 31.7% |
| South American Indians | 47.7 /100 | #177 | Average 31.7% |
| English | 47.4 /100 | #178 | Average 31.7% |
| South Americans | 46.9 /100 | #179 | Average 31.8% |
| Moroccans | 45.7 /100 | #180 | Average 31.8% |
| Immigrants | Peru | 45.1 /100 | #181 | Average 31.8% |
| Kenyans | 43.0 /100 | #182 | Average 31.9% |
| Canadians | 41.4 /100 | #183 | Average 31.9% |
| Immigrants | South America | 40.7 /100 | #184 | Average 32.0% |
| Germans | 39.5 /100 | #185 | Fair 32.0% |
| Welsh | 38.2 /100 | #186 | Fair 32.0% |
Demographics Similar to Vietnamese by Births to Unmarried Women
In terms of births to unmarried women, the demographic groups most similar to Vietnamese are Croatian (30.2%, a difference of 0.070%), Syrian (30.2%, a difference of 0.11%), European (30.2%, a difference of 0.12%), Chinese (30.2%, a difference of 0.14%), and Immigrants from Argentina (30.1%, a difference of 0.24%).
| Demographics | Rating | Rank | Births to Unmarried Women |
| Immigrants | Norway | 91.0 /100 | #118 | Exceptional 29.9% |
| Argentineans | 90.5 /100 | #119 | Exceptional 30.0% |
| Ugandans | 89.2 /100 | #120 | Excellent 30.1% |
| Koreans | 88.9 /100 | #121 | Excellent 30.1% |
| Immigrants | Argentina | 88.7 /100 | #122 | Excellent 30.1% |
| Syrians | 88.2 /100 | #123 | Excellent 30.2% |
| Croatians | 88.0 /100 | #124 | Excellent 30.2% |
| Vietnamese | 87.7 /100 | #125 | Excellent 30.2% |
| Europeans | 87.2 /100 | #126 | Excellent 30.2% |
| Chinese | 87.1 /100 | #127 | Excellent 30.2% |
| Icelanders | 86.0 /100 | #128 | Excellent 30.3% |
| Immigrants | Spain | 85.8 /100 | #129 | Excellent 30.3% |
| Immigrants | Bosnia and Herzegovina | 85.7 /100 | #130 | Excellent 30.3% |
| Immigrants | Zimbabwe | 85.7 /100 | #131 | Excellent 30.3% |
| New Zealanders | 85.5 /100 | #132 | Excellent 30.3% |