South American Indian vs Immigrants from Cabo Verde Unemployment
COMPARE
South American Indian
Immigrants from Cabo Verde
Unemployment
Unemployment Comparison
South American Indians
Immigrants from Cabo Verde
5.5%
UNEMPLOYMENT
7.8/ 100
METRIC RATING
225th/ 347
METRIC RANK
6.8%
UNEMPLOYMENT
0.0/ 100
METRIC RATING
318th/ 347
METRIC RANK
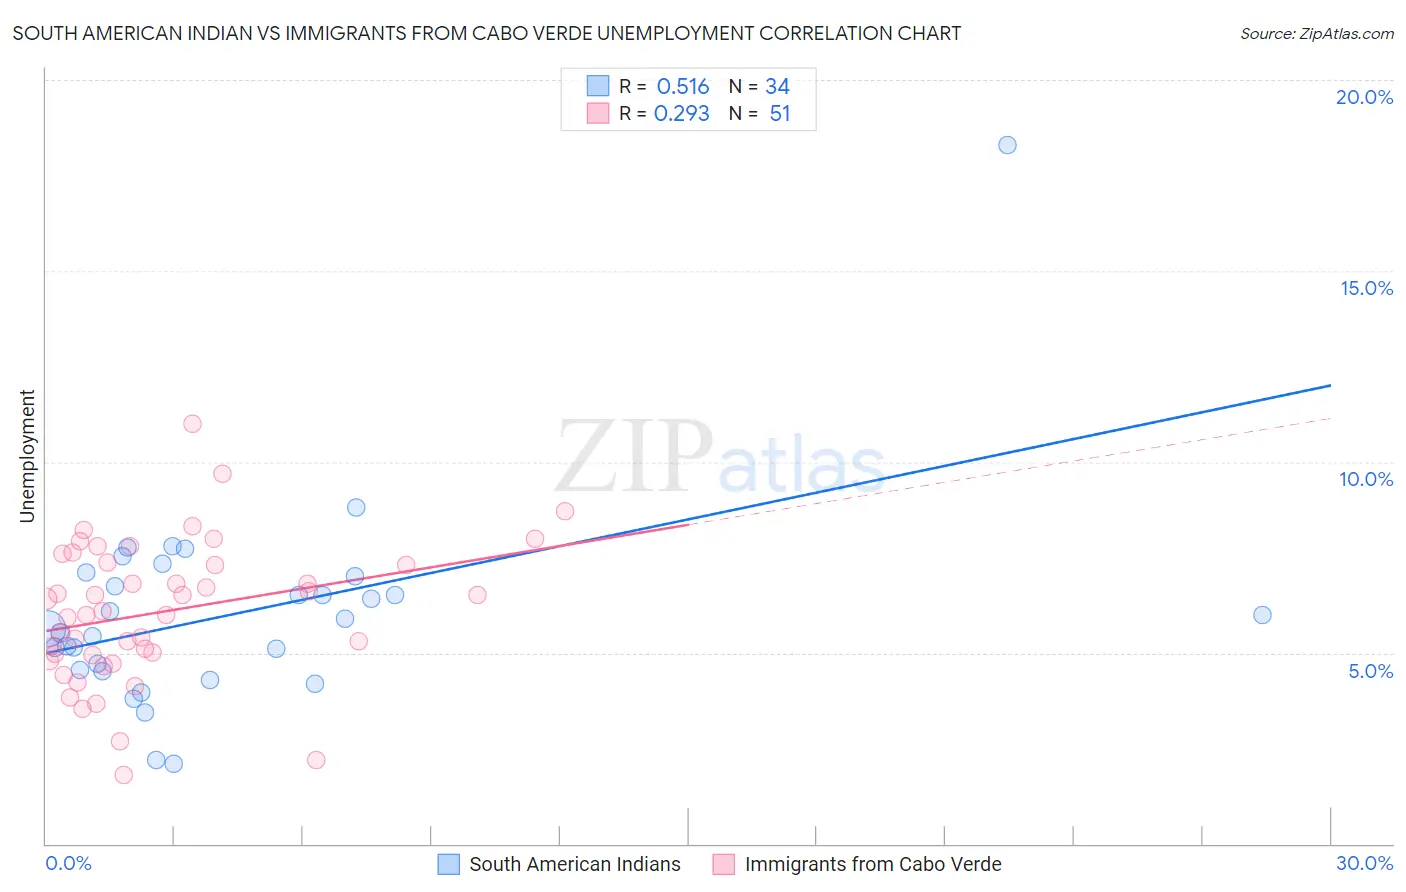
South American Indian vs Immigrants from Cabo Verde Unemployment Correlation Chart
The statistical analysis conducted on geographies consisting of 164,508,127 people shows a substantial positive correlation between the proportion of South American Indians and unemployment in the United States with a correlation coefficient (R) of 0.516 and weighted average of 5.5%. Similarly, the statistical analysis conducted on geographies consisting of 38,137,601 people shows a weak positive correlation between the proportion of Immigrants from Cabo Verde and unemployment in the United States with a correlation coefficient (R) of 0.293 and weighted average of 6.8%, a difference of 25.0%.
Unemployment Correlation Summary
| Measurement | South American Indian | Immigrants from Cabo Verde |
| Minimum | 2.1% | 1.8% |
| Maximum | 18.3% | 11.0% |
| Range | 16.2% | 9.2% |
| Mean | 6.0% | 6.1% |
| Median | 5.8% | 6.1% |
| Interquartile 25% (IQ1) | 4.5% | 4.9% |
| Interquartile 75% (IQ3) | 7.0% | 7.4% |
| Interquartile Range (IQR) | 2.5% | 2.4% |
| Standard Deviation (Sample) | 2.7% | 1.8% |
| Standard Deviation (Population) | 2.6% | 1.8% |
Similar Demographics by Unemployment
Demographics Similar to South American Indians by Unemployment
In terms of unemployment, the demographic groups most similar to South American Indians are Samoan (5.5%, a difference of 0.15%), Immigrants from Lebanon (5.5%, a difference of 0.18%), Israeli (5.4%, a difference of 0.20%), Seminole (5.4%, a difference of 0.27%), and Guamanian/Chamorro (5.5%, a difference of 0.33%).
| Demographics | Rating | Rank | Unemployment |
| Choctaw | 12.7 /100 | #218 | Poor 5.4% |
| Bangladeshis | 11.2 /100 | #219 | Poor 5.4% |
| Soviet Union | 10.6 /100 | #220 | Poor 5.4% |
| Immigrants | Philippines | 10.4 /100 | #221 | Poor 5.4% |
| Iroquois | 10.3 /100 | #222 | Poor 5.4% |
| Seminole | 9.2 /100 | #223 | Tragic 5.4% |
| Israelis | 8.8 /100 | #224 | Tragic 5.4% |
| South American Indians | 7.8 /100 | #225 | Tragic 5.5% |
| Samoans | 7.1 /100 | #226 | Tragic 5.5% |
| Immigrants | Lebanon | 7.0 /100 | #227 | Tragic 5.5% |
| Guamanians/Chamorros | 6.3 /100 | #228 | Tragic 5.5% |
| Hawaiians | 5.4 /100 | #229 | Tragic 5.5% |
| Ottawa | 5.4 /100 | #230 | Tragic 5.5% |
| Immigrants | Africa | 4.9 /100 | #231 | Tragic 5.5% |
| Comanche | 4.9 /100 | #232 | Tragic 5.5% |
Demographics Similar to Immigrants from Cabo Verde by Unemployment
In terms of unemployment, the demographic groups most similar to Immigrants from Cabo Verde are British West Indian (6.8%, a difference of 0.21%), Shoshone (6.8%, a difference of 0.60%), Immigrants from St. Vincent and the Grenadines (6.9%, a difference of 1.0%), Immigrants from Guyana (6.9%, a difference of 1.0%), and Guyanese (6.9%, a difference of 1.1%).
| Demographics | Rating | Rank | Unemployment |
| Cape Verdeans | 0.0 /100 | #311 | Tragic 6.5% |
| Colville | 0.0 /100 | #312 | Tragic 6.6% |
| Immigrants | Barbados | 0.0 /100 | #313 | Tragic 6.6% |
| Blacks/African Americans | 0.0 /100 | #314 | Tragic 6.6% |
| Houma | 0.0 /100 | #315 | Tragic 6.7% |
| Immigrants | Dominica | 0.0 /100 | #316 | Tragic 6.7% |
| Shoshone | 0.0 /100 | #317 | Tragic 6.8% |
| Immigrants | Cabo Verde | 0.0 /100 | #318 | Tragic 6.8% |
| British West Indians | 0.0 /100 | #319 | Tragic 6.8% |
| Immigrants | St. Vincent and the Grenadines | 0.0 /100 | #320 | Tragic 6.9% |
| Immigrants | Guyana | 0.0 /100 | #321 | Tragic 6.9% |
| Guyanese | 0.0 /100 | #322 | Tragic 6.9% |
| Immigrants | Grenada | 0.0 /100 | #323 | Tragic 6.9% |
| Immigrants | Armenia | 0.0 /100 | #324 | Tragic 7.0% |
| Natives/Alaskans | 0.0 /100 | #325 | Tragic 7.0% |