Slovak vs Alaskan Athabascan Female Unemployment
COMPARE
Slovak
Alaskan Athabascan
Female Unemployment
Female Unemployment Comparison
Slovaks
Alaskan Athabascans
4.8%
FEMALE UNEMPLOYMENT
99.8/ 100
METRIC RATING
32nd/ 347
METRIC RANK
6.1%
FEMALE UNEMPLOYMENT
0.0/ 100
METRIC RATING
296th/ 347
METRIC RANK
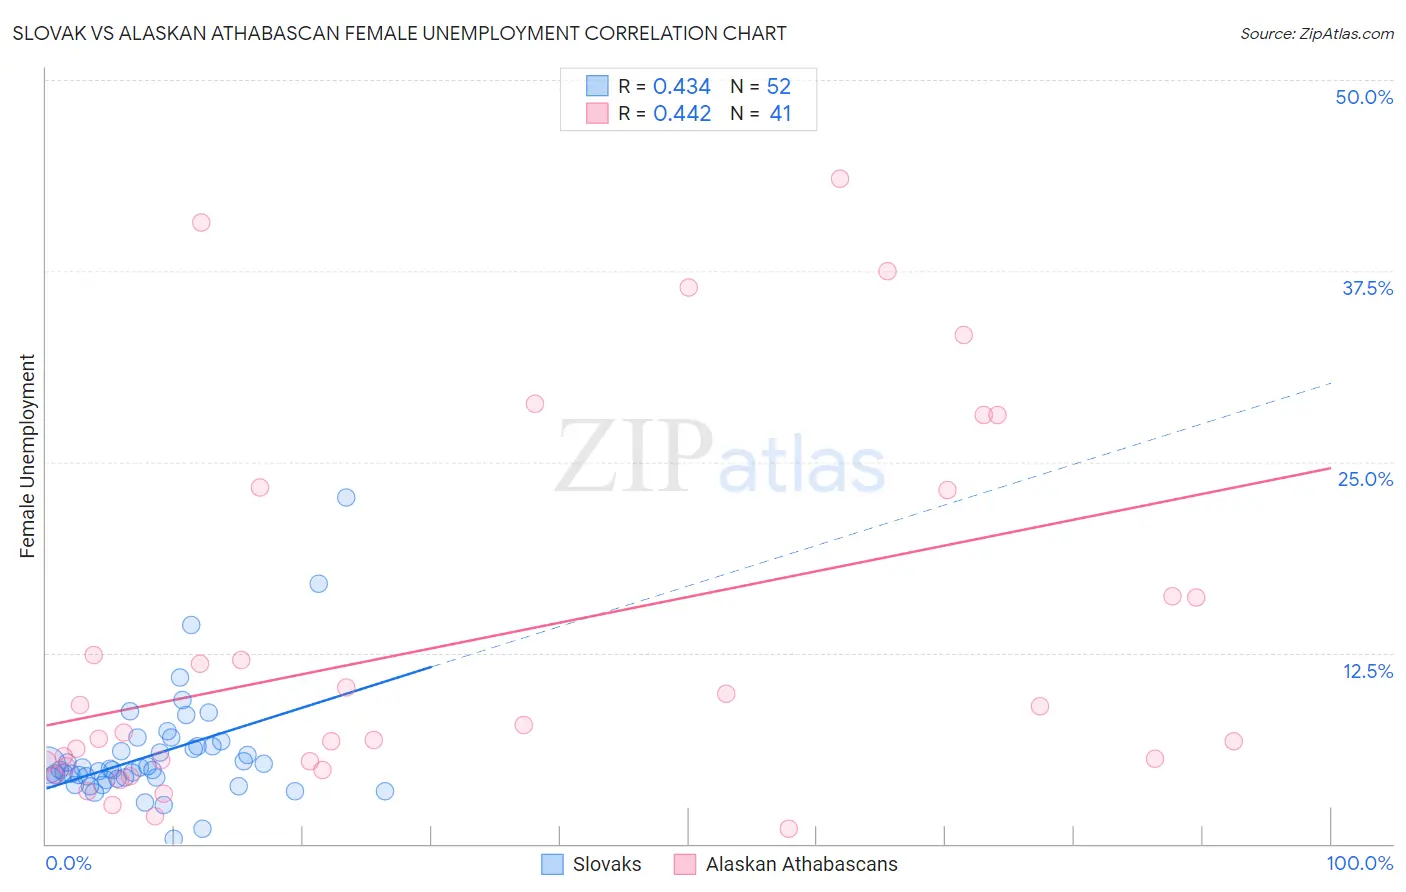
Slovak vs Alaskan Athabascan Female Unemployment Correlation Chart
The statistical analysis conducted on geographies consisting of 394,798,078 people shows a moderate positive correlation between the proportion of Slovaks and unemploymnet rate among females in the United States with a correlation coefficient (R) of 0.434 and weighted average of 4.8%. Similarly, the statistical analysis conducted on geographies consisting of 45,741,943 people shows a moderate positive correlation between the proportion of Alaskan Athabascans and unemploymnet rate among females in the United States with a correlation coefficient (R) of 0.442 and weighted average of 6.1%, a difference of 28.5%.
Female Unemployment Correlation Summary
| Measurement | Slovak | Alaskan Athabascan |
| Minimum | 0.30% | 1.0% |
| Maximum | 22.7% | 43.5% |
| Range | 22.4% | 42.5% |
| Mean | 5.9% | 13.2% |
| Median | 4.9% | 7.3% |
| Interquartile 25% (IQ1) | 4.3% | 5.2% |
| Interquartile 75% (IQ3) | 6.4% | 19.7% |
| Interquartile Range (IQR) | 2.1% | 14.4% |
| Standard Deviation (Sample) | 3.7% | 11.9% |
| Standard Deviation (Population) | 3.6% | 11.8% |
Similar Demographics by Female Unemployment
Demographics Similar to Slovaks by Female Unemployment
In terms of female unemployment, the demographic groups most similar to Slovaks are Sudanese (4.8%, a difference of 0.14%), Lithuanian (4.7%, a difference of 0.42%), Czechoslovakian (4.8%, a difference of 0.51%), Cypriot (4.7%, a difference of 0.54%), and Zimbabwean (4.8%, a difference of 0.54%).
| Demographics | Rating | Rank | Female Unemployment |
| Immigrants | India | 99.9 /100 | #25 | Exceptional 4.7% |
| Immigrants | Bosnia and Herzegovina | 99.9 /100 | #26 | Exceptional 4.7% |
| British | 99.9 /100 | #27 | Exceptional 4.7% |
| Irish | 99.9 /100 | #28 | Exceptional 4.7% |
| Cypriots | 99.9 /100 | #29 | Exceptional 4.7% |
| Lithuanians | 99.8 /100 | #30 | Exceptional 4.7% |
| Sudanese | 99.8 /100 | #31 | Exceptional 4.8% |
| Slovaks | 99.8 /100 | #32 | Exceptional 4.8% |
| Czechoslovakians | 99.7 /100 | #33 | Exceptional 4.8% |
| Zimbabweans | 99.7 /100 | #34 | Exceptional 4.8% |
| French Canadians | 99.7 /100 | #35 | Exceptional 4.8% |
| Yugoslavians | 99.7 /100 | #36 | Exceptional 4.8% |
| Pennsylvania Germans | 99.6 /100 | #37 | Exceptional 4.8% |
| Northern Europeans | 99.6 /100 | #38 | Exceptional 4.8% |
| Scotch-Irish | 99.6 /100 | #39 | Exceptional 4.8% |
Demographics Similar to Alaskan Athabascans by Female Unemployment
In terms of female unemployment, the demographic groups most similar to Alaskan Athabascans are West Indian (6.1%, a difference of 0.010%), Immigrants from Latin America (6.1%, a difference of 0.020%), Jamaican (6.1%, a difference of 0.030%), Immigrants from El Salvador (6.1%, a difference of 0.12%), and Ute (6.1%, a difference of 0.13%).
| Demographics | Rating | Rank | Female Unemployment |
| Trinidadians and Tobagonians | 0.0 /100 | #289 | Tragic 6.1% |
| Immigrants | Caribbean | 0.0 /100 | #290 | Tragic 6.1% |
| Immigrants | West Indies | 0.0 /100 | #291 | Tragic 6.1% |
| Immigrants | Trinidad and Tobago | 0.0 /100 | #292 | Tragic 6.1% |
| Mexicans | 0.0 /100 | #293 | Tragic 6.1% |
| Immigrants | El Salvador | 0.0 /100 | #294 | Tragic 6.1% |
| Immigrants | Latin America | 0.0 /100 | #295 | Tragic 6.1% |
| Alaskan Athabascans | 0.0 /100 | #296 | Tragic 6.1% |
| West Indians | 0.0 /100 | #297 | Tragic 6.1% |
| Jamaicans | 0.0 /100 | #298 | Tragic 6.1% |
| Ute | 0.0 /100 | #299 | Tragic 6.1% |
| Immigrants | Haiti | 0.0 /100 | #300 | Tragic 6.1% |
| Immigrants | Barbados | 0.0 /100 | #301 | Tragic 6.2% |
| U.S. Virgin Islanders | 0.0 /100 | #302 | Tragic 6.2% |
| Barbadians | 0.0 /100 | #303 | Tragic 6.2% |