Jordanian vs Alaskan Athabascan Female Unemployment
COMPARE
Jordanian
Alaskan Athabascan
Female Unemployment
Female Unemployment Comparison
Jordanians
Alaskan Athabascans
5.1%
FEMALE UNEMPLOYMENT
90.3/ 100
METRIC RATING
117th/ 347
METRIC RANK
6.1%
FEMALE UNEMPLOYMENT
0.0/ 100
METRIC RATING
296th/ 347
METRIC RANK
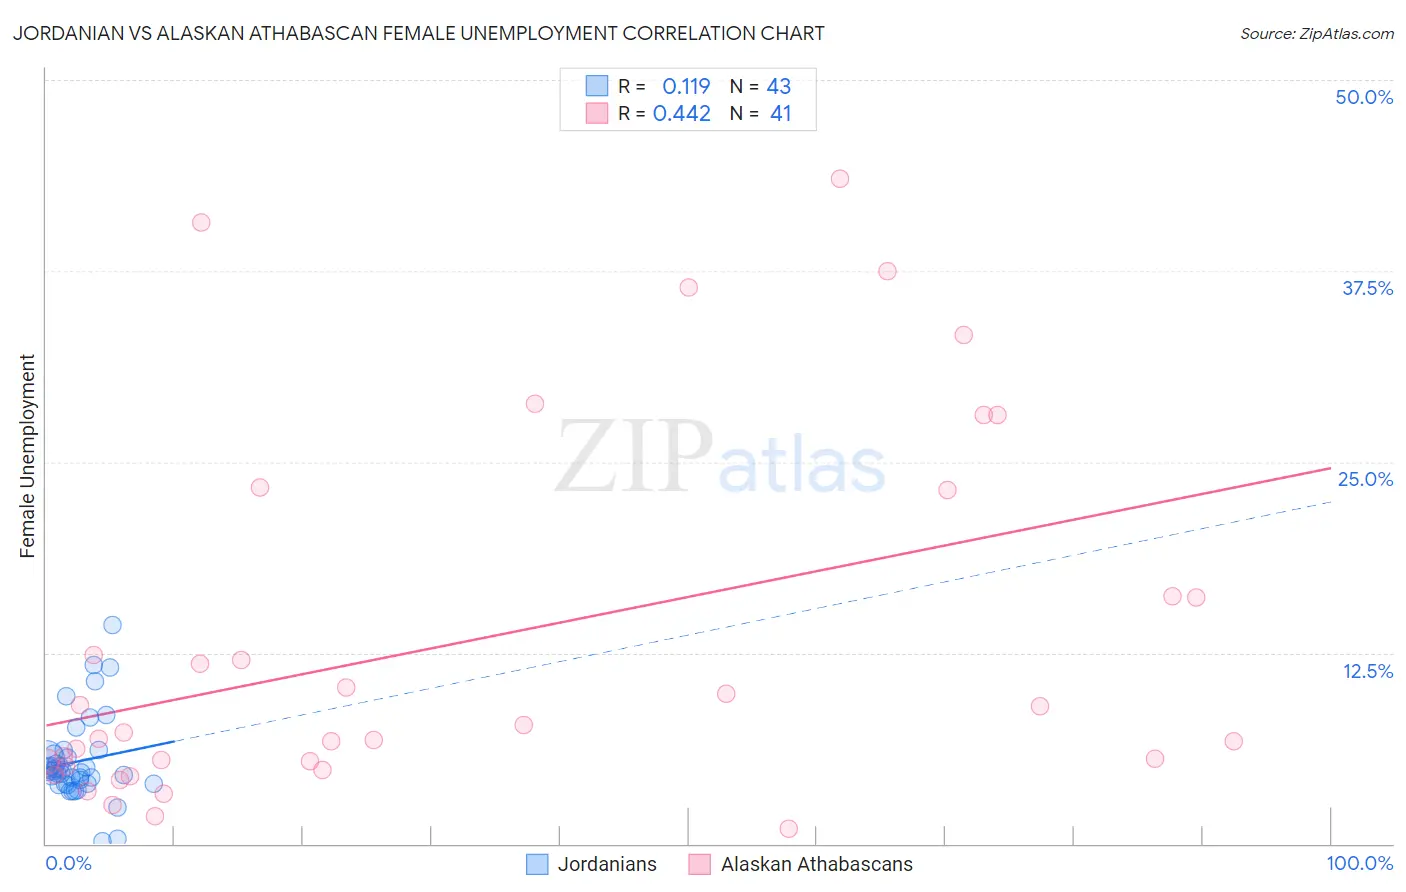
Jordanian vs Alaskan Athabascan Female Unemployment Correlation Chart
The statistical analysis conducted on geographies consisting of 166,280,394 people shows a poor positive correlation between the proportion of Jordanians and unemploymnet rate among females in the United States with a correlation coefficient (R) of 0.119 and weighted average of 5.1%. Similarly, the statistical analysis conducted on geographies consisting of 45,741,943 people shows a moderate positive correlation between the proportion of Alaskan Athabascans and unemploymnet rate among females in the United States with a correlation coefficient (R) of 0.442 and weighted average of 6.1%, a difference of 20.5%.
Female Unemployment Correlation Summary
| Measurement | Jordanian | Alaskan Athabascan |
| Minimum | 0.20% | 1.0% |
| Maximum | 14.3% | 43.5% |
| Range | 14.1% | 42.5% |
| Mean | 5.4% | 13.2% |
| Median | 4.8% | 7.3% |
| Interquartile 25% (IQ1) | 3.9% | 5.2% |
| Interquartile 75% (IQ3) | 5.9% | 19.7% |
| Interquartile Range (IQR) | 2.0% | 14.4% |
| Standard Deviation (Sample) | 2.8% | 11.9% |
| Standard Deviation (Population) | 2.8% | 11.8% |
Similar Demographics by Female Unemployment
Demographics Similar to Jordanians by Female Unemployment
In terms of female unemployment, the demographic groups most similar to Jordanians are American (5.1%, a difference of 0.040%), Immigrants from Croatia (5.1%, a difference of 0.060%), Lebanese (5.1%, a difference of 0.12%), Immigrants from Turkey (5.1%, a difference of 0.14%), and Immigrants from Saudi Arabia (5.1%, a difference of 0.18%).
| Demographics | Rating | Rank | Female Unemployment |
| Macedonians | 92.4 /100 | #110 | Exceptional 5.1% |
| Immigrants | Burma/Myanmar | 92.3 /100 | #111 | Exceptional 5.1% |
| Estonians | 92.1 /100 | #112 | Exceptional 5.1% |
| Immigrants | Saudi Arabia | 91.2 /100 | #113 | Exceptional 5.1% |
| Immigrants | Turkey | 91.0 /100 | #114 | Exceptional 5.1% |
| Lebanese | 91.0 /100 | #115 | Exceptional 5.1% |
| Americans | 90.5 /100 | #116 | Exceptional 5.1% |
| Jordanians | 90.3 /100 | #117 | Exceptional 5.1% |
| Immigrants | Croatia | 89.9 /100 | #118 | Excellent 5.1% |
| Immigrants | North Macedonia | 88.3 /100 | #119 | Excellent 5.1% |
| Immigrants | Romania | 88.1 /100 | #120 | Excellent 5.1% |
| Immigrants | Western Europe | 88.1 /100 | #121 | Excellent 5.1% |
| Immigrants | Germany | 87.6 /100 | #122 | Excellent 5.1% |
| Immigrants | South Africa | 87.6 /100 | #123 | Excellent 5.1% |
| Immigrants | Europe | 87.2 /100 | #124 | Excellent 5.1% |
Demographics Similar to Alaskan Athabascans by Female Unemployment
In terms of female unemployment, the demographic groups most similar to Alaskan Athabascans are West Indian (6.1%, a difference of 0.010%), Immigrants from Latin America (6.1%, a difference of 0.020%), Jamaican (6.1%, a difference of 0.030%), Immigrants from El Salvador (6.1%, a difference of 0.12%), and Ute (6.1%, a difference of 0.13%).
| Demographics | Rating | Rank | Female Unemployment |
| Trinidadians and Tobagonians | 0.0 /100 | #289 | Tragic 6.1% |
| Immigrants | Caribbean | 0.0 /100 | #290 | Tragic 6.1% |
| Immigrants | West Indies | 0.0 /100 | #291 | Tragic 6.1% |
| Immigrants | Trinidad and Tobago | 0.0 /100 | #292 | Tragic 6.1% |
| Mexicans | 0.0 /100 | #293 | Tragic 6.1% |
| Immigrants | El Salvador | 0.0 /100 | #294 | Tragic 6.1% |
| Immigrants | Latin America | 0.0 /100 | #295 | Tragic 6.1% |
| Alaskan Athabascans | 0.0 /100 | #296 | Tragic 6.1% |
| West Indians | 0.0 /100 | #297 | Tragic 6.1% |
| Jamaicans | 0.0 /100 | #298 | Tragic 6.1% |
| Ute | 0.0 /100 | #299 | Tragic 6.1% |
| Immigrants | Haiti | 0.0 /100 | #300 | Tragic 6.1% |
| Immigrants | Barbados | 0.0 /100 | #301 | Tragic 6.2% |
| U.S. Virgin Islanders | 0.0 /100 | #302 | Tragic 6.2% |
| Barbadians | 0.0 /100 | #303 | Tragic 6.2% |