Scotch-Irish vs Ugandan Unemployment Among Seniors over 75 years
COMPARE
Scotch-Irish
Ugandan
Unemployment Among Seniors over 75 years
Unemployment Among Seniors over 75 years Comparison
Scotch-Irish
Ugandans
10.0%
UNEMPLOYMENT AMONG SENIORS OVER 75 YEARS
0.0/ 100
METRIC RATING
304th/ 347
METRIC RANK
7.7%
UNEMPLOYMENT AMONG SENIORS OVER 75 YEARS
100.0/ 100
METRIC RATING
39th/ 347
METRIC RANK
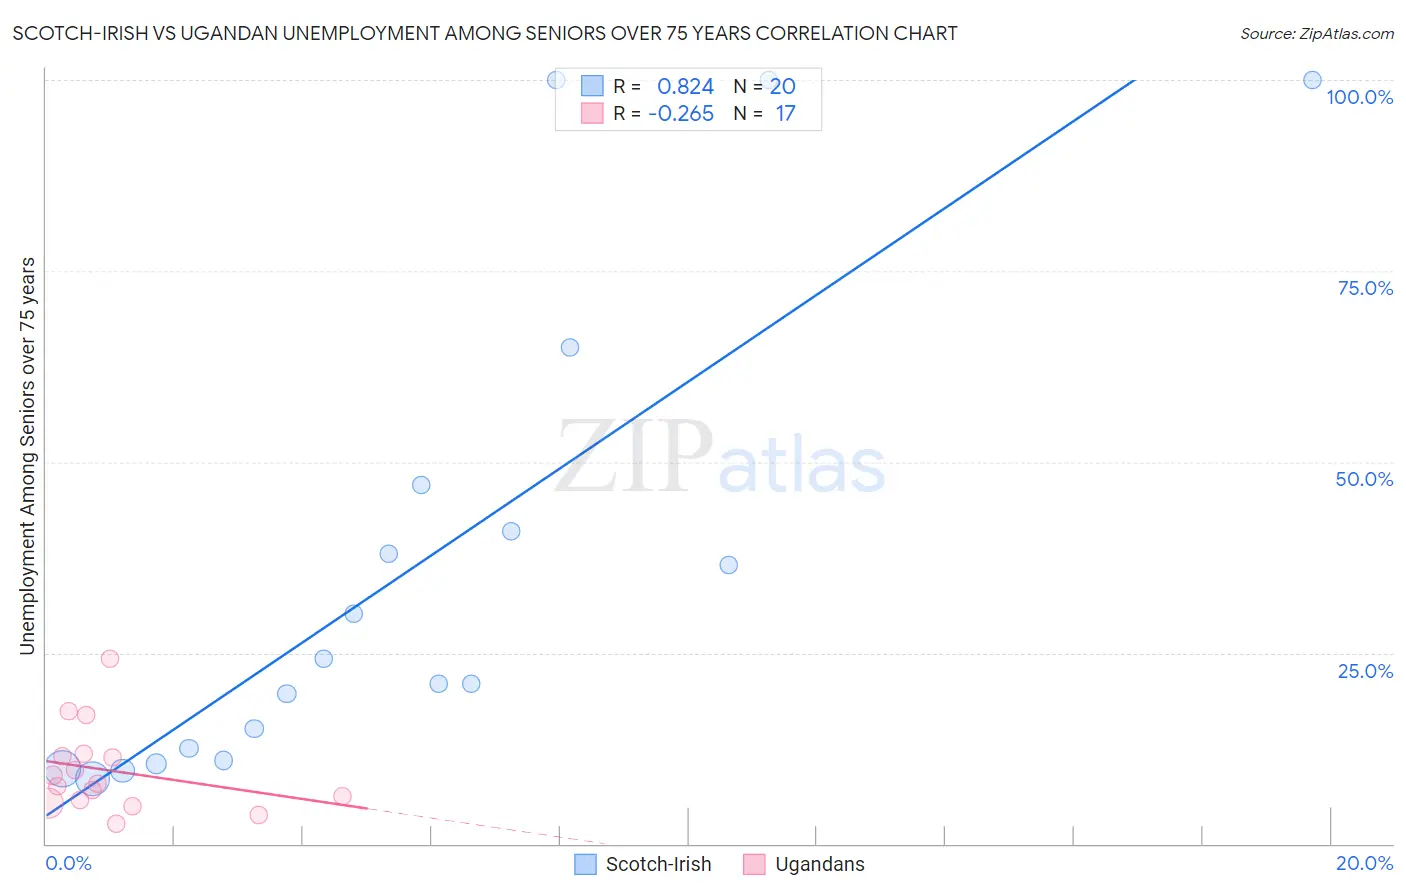
Scotch-Irish vs Ugandan Unemployment Among Seniors over 75 years Correlation Chart
The statistical analysis conducted on geographies consisting of 229,322,772 people shows a very strong positive correlation between the proportion of Scotch-Irish and unemployment rate among seniors over the age of 75 in the United States with a correlation coefficient (R) of 0.824 and weighted average of 10.0%. Similarly, the statistical analysis conducted on geographies consisting of 74,859,637 people shows a weak negative correlation between the proportion of Ugandans and unemployment rate among seniors over the age of 75 in the United States with a correlation coefficient (R) of -0.265 and weighted average of 7.7%, a difference of 29.3%.
Unemployment Among Seniors over 75 years Correlation Summary
| Measurement | Scotch-Irish | Ugandan |
| Minimum | 8.5% | 2.7% |
| Maximum | 100.0% | 24.3% |
| Range | 91.5% | 21.6% |
| Mean | 36.0% | 9.6% |
| Median | 22.6% | 7.8% |
| Interquartile 25% (IQ1) | 11.7% | 5.5% |
| Interquartile 75% (IQ3) | 44.0% | 11.6% |
| Interquartile Range (IQR) | 32.3% | 6.1% |
| Standard Deviation (Sample) | 31.3% | 5.6% |
| Standard Deviation (Population) | 30.5% | 5.4% |
Similar Demographics by Unemployment Among Seniors over 75 years
Demographics Similar to Scotch-Irish by Unemployment Among Seniors over 75 years
In terms of unemployment among seniors over 75 years, the demographic groups most similar to Scotch-Irish are Puget Sound Salish (10.0%, a difference of 0.010%), Finnish (10.0%, a difference of 0.080%), Welsh (10.0%, a difference of 0.19%), Swedish (10.0%, a difference of 0.19%), and Italian (10.0%, a difference of 0.34%).
| Demographics | Rating | Rank | Unemployment Among Seniors over 75 years |
| Cherokee | 0.0 /100 | #297 | Tragic 9.8% |
| Lithuanians | 0.0 /100 | #298 | Tragic 9.9% |
| Belgians | 0.0 /100 | #299 | Tragic 9.9% |
| Iraqis | 0.0 /100 | #300 | Tragic 9.9% |
| Welsh | 0.0 /100 | #301 | Tragic 10.0% |
| Finns | 0.0 /100 | #302 | Tragic 10.0% |
| Puget Sound Salish | 0.0 /100 | #303 | Tragic 10.0% |
| Scotch-Irish | 0.0 /100 | #304 | Tragic 10.0% |
| Swedes | 0.0 /100 | #305 | Tragic 10.0% |
| Italians | 0.0 /100 | #306 | Tragic 10.0% |
| Immigrants | Fiji | 0.0 /100 | #307 | Tragic 10.0% |
| Whites/Caucasians | 0.0 /100 | #308 | Tragic 10.1% |
| English | 0.0 /100 | #309 | Tragic 10.1% |
| Hungarians | 0.0 /100 | #310 | Tragic 10.1% |
| Scottish | 0.0 /100 | #311 | Tragic 10.1% |
Demographics Similar to Ugandans by Unemployment Among Seniors over 75 years
In terms of unemployment among seniors over 75 years, the demographic groups most similar to Ugandans are Colville (7.7%, a difference of 0.020%), Kiowa (7.7%, a difference of 0.040%), Immigrants from Hungary (7.7%, a difference of 0.050%), Immigrants from Burma/Myanmar (7.7%, a difference of 0.16%), and Luxembourger (7.7%, a difference of 0.25%).
| Demographics | Rating | Rank | Unemployment Among Seniors over 75 years |
| Immigrants | Hong Kong | 100.0 /100 | #32 | Exceptional 7.6% |
| Cambodians | 100.0 /100 | #33 | Exceptional 7.6% |
| Immigrants | Eritrea | 100.0 /100 | #34 | Exceptional 7.7% |
| Immigrants | Norway | 100.0 /100 | #35 | Exceptional 7.7% |
| Luxembourgers | 100.0 /100 | #36 | Exceptional 7.7% |
| Immigrants | Hungary | 100.0 /100 | #37 | Exceptional 7.7% |
| Kiowa | 100.0 /100 | #38 | Exceptional 7.7% |
| Ugandans | 100.0 /100 | #39 | Exceptional 7.7% |
| Colville | 100.0 /100 | #40 | Exceptional 7.7% |
| Immigrants | Burma/Myanmar | 100.0 /100 | #41 | Exceptional 7.7% |
| Pueblo | 100.0 /100 | #42 | Exceptional 7.7% |
| Immigrants | Denmark | 100.0 /100 | #43 | Exceptional 7.8% |
| Immigrants | Spain | 100.0 /100 | #44 | Exceptional 7.8% |
| British West Indians | 100.0 /100 | #45 | Exceptional 7.8% |
| Immigrants | China | 100.0 /100 | #46 | Exceptional 7.8% |