Scotch-Irish vs Danish Unemployment Among Seniors over 75 years
COMPARE
Scotch-Irish
Danish
Unemployment Among Seniors over 75 years
Unemployment Among Seniors over 75 years Comparison
Scotch-Irish
Danes
10.0%
UNEMPLOYMENT AMONG SENIORS OVER 75 YEARS
0.0/ 100
METRIC RATING
304th/ 347
METRIC RANK
9.7%
UNEMPLOYMENT AMONG SENIORS OVER 75 YEARS
0.0/ 100
METRIC RATING
287th/ 347
METRIC RANK
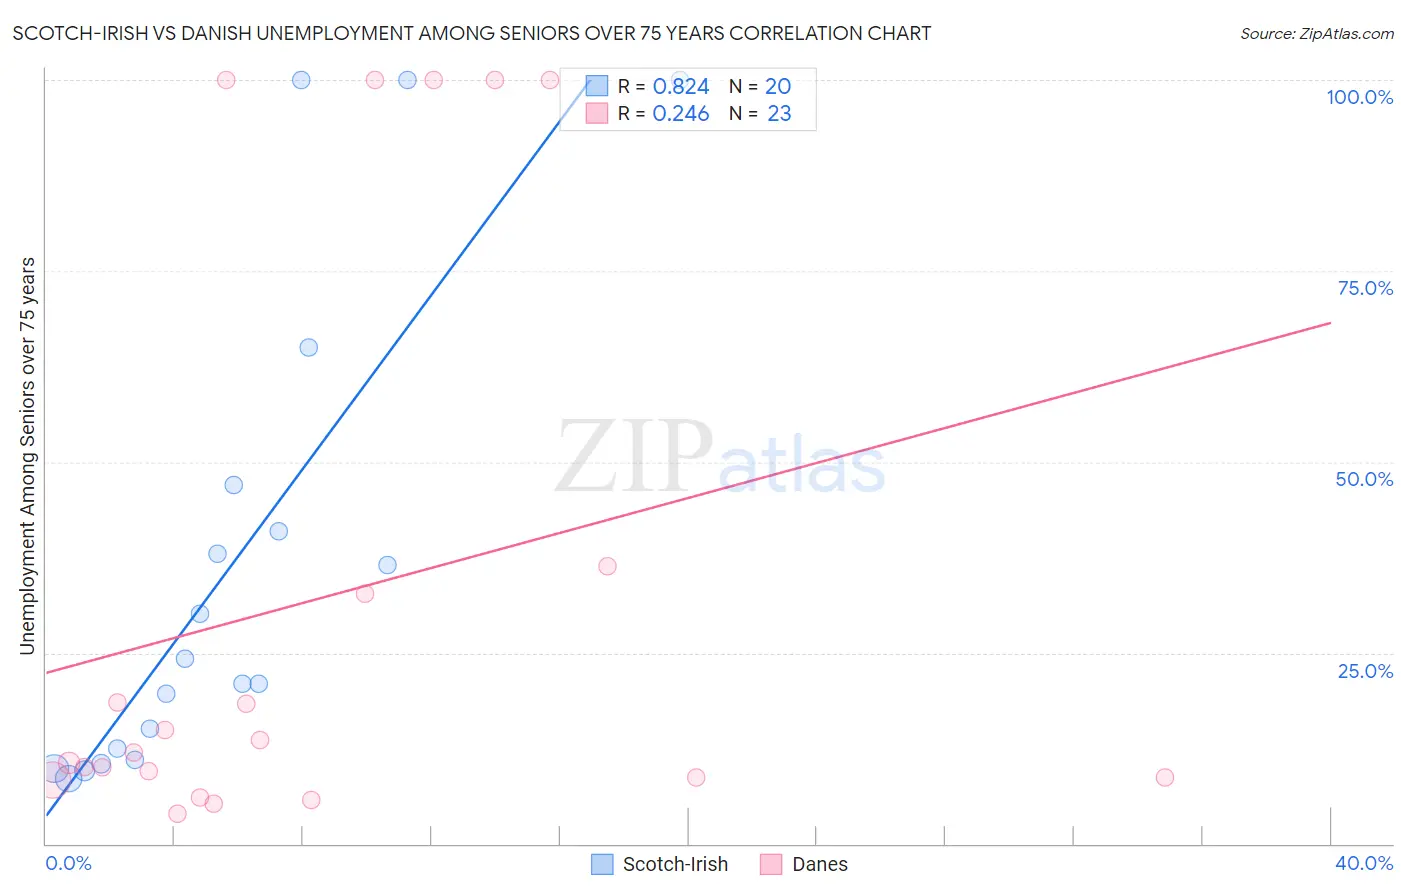
Scotch-Irish vs Danish Unemployment Among Seniors over 75 years Correlation Chart
The statistical analysis conducted on geographies consisting of 229,322,772 people shows a very strong positive correlation between the proportion of Scotch-Irish and unemployment rate among seniors over the age of 75 in the United States with a correlation coefficient (R) of 0.824 and weighted average of 10.0%. Similarly, the statistical analysis conducted on geographies consisting of 216,837,655 people shows a weak positive correlation between the proportion of Danes and unemployment rate among seniors over the age of 75 in the United States with a correlation coefficient (R) of 0.246 and weighted average of 9.7%, a difference of 3.0%.
Unemployment Among Seniors over 75 years Correlation Summary
| Measurement | Scotch-Irish | Danish |
| Minimum | 8.5% | 3.9% |
| Maximum | 100.0% | 100.0% |
| Range | 91.5% | 96.1% |
| Mean | 36.0% | 31.9% |
| Median | 22.6% | 11.9% |
| Interquartile 25% (IQ1) | 11.7% | 8.7% |
| Interquartile 75% (IQ3) | 44.0% | 36.4% |
| Interquartile Range (IQR) | 32.3% | 27.7% |
| Standard Deviation (Sample) | 31.3% | 37.5% |
| Standard Deviation (Population) | 30.5% | 36.7% |
Demographics Similar to Scotch-Irish and Danes by Unemployment Among Seniors over 75 years
In terms of unemployment among seniors over 75 years, the demographic groups most similar to Scotch-Irish are Puget Sound Salish (10.0%, a difference of 0.010%), Finnish (10.0%, a difference of 0.080%), Welsh (10.0%, a difference of 0.19%), Swedish (10.0%, a difference of 0.19%), and Iraqi (9.9%, a difference of 0.61%). Similarly, the demographic groups most similar to Danes are Nigerian (9.7%, a difference of 0.11%), Canadian (9.7%, a difference of 0.14%), Carpatho Rusyn (9.7%, a difference of 0.17%), Czech (9.7%, a difference of 0.22%), and Sioux (9.7%, a difference of 0.29%).
| Demographics | Rating | Rank | Unemployment Among Seniors over 75 years |
| Carpatho Rusyns | 0.0 /100 | #285 | Tragic 9.7% |
| Nigerians | 0.0 /100 | #286 | Tragic 9.7% |
| Danes | 0.0 /100 | #287 | Tragic 9.7% |
| Canadians | 0.0 /100 | #288 | Tragic 9.7% |
| Czechs | 0.0 /100 | #289 | Tragic 9.7% |
| Sioux | 0.0 /100 | #290 | Tragic 9.7% |
| Scandinavians | 0.0 /100 | #291 | Tragic 9.7% |
| Immigrants | Western Africa | 0.0 /100 | #292 | Tragic 9.8% |
| Norwegians | 0.0 /100 | #293 | Tragic 9.8% |
| Immigrants | Dominica | 0.0 /100 | #294 | Tragic 9.8% |
| Immigrants | Nonimmigrants | 0.0 /100 | #295 | Tragic 9.8% |
| Immigrants | St. Vincent and the Grenadines | 0.0 /100 | #296 | Tragic 9.8% |
| Cherokee | 0.0 /100 | #297 | Tragic 9.8% |
| Lithuanians | 0.0 /100 | #298 | Tragic 9.9% |
| Belgians | 0.0 /100 | #299 | Tragic 9.9% |
| Iraqis | 0.0 /100 | #300 | Tragic 9.9% |
| Welsh | 0.0 /100 | #301 | Tragic 10.0% |
| Finns | 0.0 /100 | #302 | Tragic 10.0% |
| Puget Sound Salish | 0.0 /100 | #303 | Tragic 10.0% |
| Scotch-Irish | 0.0 /100 | #304 | Tragic 10.0% |
| Swedes | 0.0 /100 | #305 | Tragic 10.0% |