Puerto Rican vs Zimbabwean Male Unemployment
COMPARE
Puerto Rican
Zimbabwean
Male Unemployment
Male Unemployment Comparison
Puerto Ricans
Zimbabweans
8.6%
MALE UNEMPLOYMENT
0.0/ 100
METRIC RATING
337th/ 347
METRIC RANK
4.8%
MALE UNEMPLOYMENT
99.9/ 100
METRIC RATING
25th/ 347
METRIC RANK
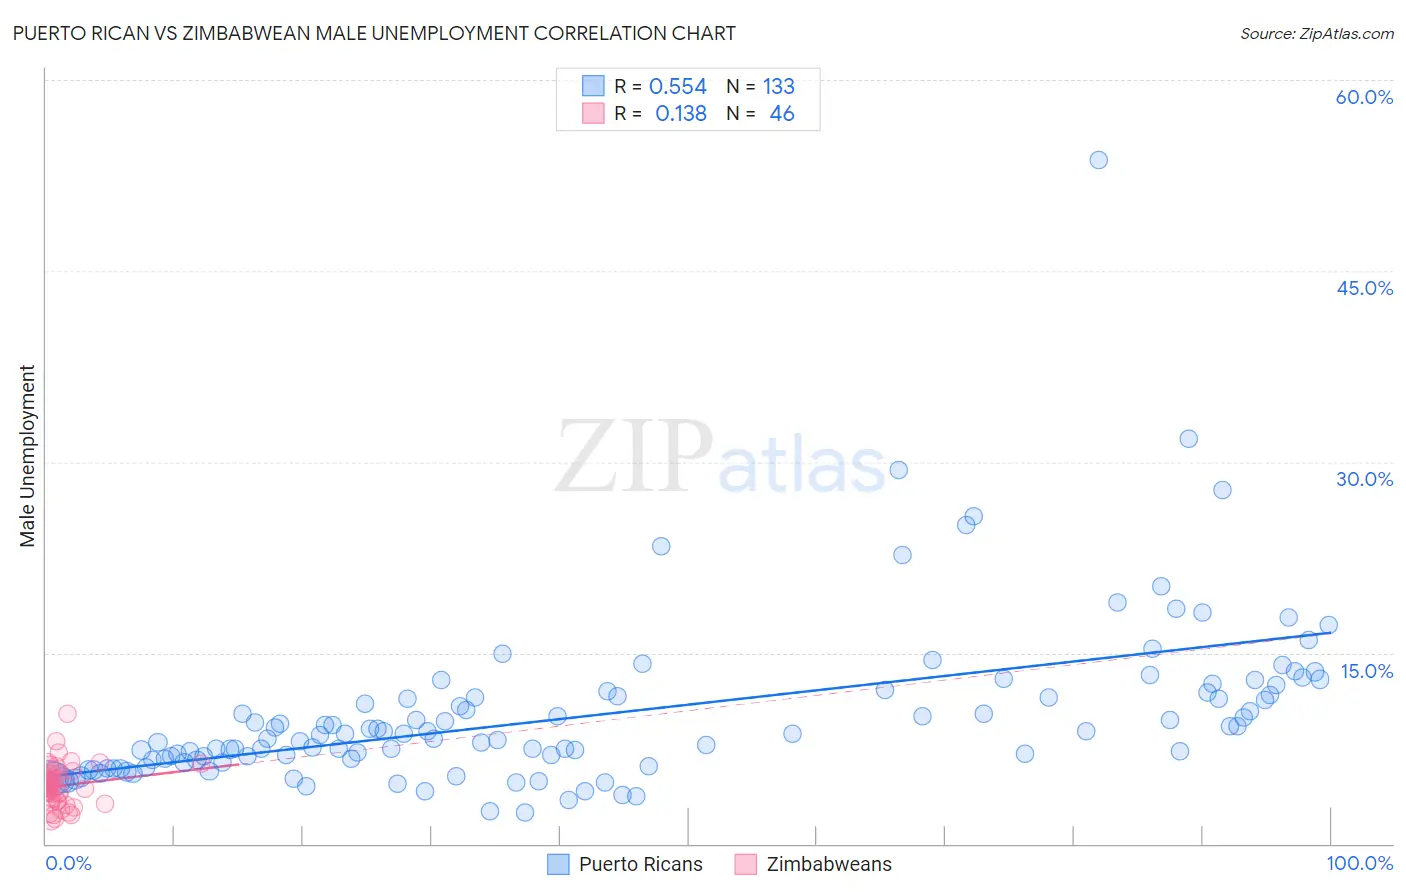
Puerto Rican vs Zimbabwean Male Unemployment Correlation Chart
The statistical analysis conducted on geographies consisting of 523,207,266 people shows a substantial positive correlation between the proportion of Puerto Ricans and unemployment rate among males in the United States with a correlation coefficient (R) of 0.554 and weighted average of 8.6%. Similarly, the statistical analysis conducted on geographies consisting of 69,161,381 people shows a poor positive correlation between the proportion of Zimbabweans and unemployment rate among males in the United States with a correlation coefficient (R) of 0.138 and weighted average of 4.8%, a difference of 79.8%.
Male Unemployment Correlation Summary
| Measurement | Puerto Rican | Zimbabwean |
| Minimum | 2.5% | 1.8% |
| Maximum | 53.7% | 10.2% |
| Range | 51.2% | 8.4% |
| Mean | 10.2% | 4.6% |
| Median | 8.6% | 4.4% |
| Interquartile 25% (IQ1) | 6.5% | 3.3% |
| Interquartile 75% (IQ3) | 11.8% | 5.5% |
| Interquartile Range (IQR) | 5.4% | 2.2% |
| Standard Deviation (Sample) | 6.6% | 1.7% |
| Standard Deviation (Population) | 6.5% | 1.7% |
Similar Demographics by Male Unemployment
Demographics Similar to Puerto Ricans by Male Unemployment
In terms of male unemployment, the demographic groups most similar to Puerto Ricans are Yuman (8.6%, a difference of 0.080%), Apache (8.6%, a difference of 0.15%), Pueblo (8.5%, a difference of 1.4%), Tsimshian (8.5%, a difference of 1.5%), and Sioux (8.4%, a difference of 2.5%).
| Demographics | Rating | Rank | Male Unemployment |
| Yakama | 0.0 /100 | #330 | Tragic 7.9% |
| Alaska Natives | 0.0 /100 | #331 | Tragic 8.1% |
| Pima | 0.0 /100 | #332 | Tragic 8.3% |
| Sioux | 0.0 /100 | #333 | Tragic 8.4% |
| Tsimshian | 0.0 /100 | #334 | Tragic 8.5% |
| Pueblo | 0.0 /100 | #335 | Tragic 8.5% |
| Yuman | 0.0 /100 | #336 | Tragic 8.6% |
| Puerto Ricans | 0.0 /100 | #337 | Tragic 8.6% |
| Apache | 0.0 /100 | #338 | Tragic 8.6% |
| Cheyenne | 0.0 /100 | #339 | Tragic 9.8% |
| Alaskan Athabascans | 0.0 /100 | #340 | Tragic 9.8% |
| Navajo | 0.0 /100 | #341 | Tragic 9.8% |
| Tohono O'odham | 0.0 /100 | #342 | Tragic 10.2% |
| Crow | 0.0 /100 | #343 | Tragic 10.6% |
| Hopi | 0.0 /100 | #344 | Tragic 10.8% |
Demographics Similar to Zimbabweans by Male Unemployment
In terms of male unemployment, the demographic groups most similar to Zimbabweans are Dutch (4.8%, a difference of 0.020%), Immigrants from South Central Asia (4.8%, a difference of 0.10%), Tongan (4.8%, a difference of 0.13%), Carpatho Rusyn (4.8%, a difference of 0.18%), and Immigrants from Taiwan (4.8%, a difference of 0.19%).
| Demographics | Rating | Rank | Male Unemployment |
| English | 99.9 /100 | #18 | Exceptional 4.8% |
| Europeans | 99.9 /100 | #19 | Exceptional 4.8% |
| Pennsylvania Germans | 99.9 /100 | #20 | Exceptional 4.8% |
| Immigrants | Taiwan | 99.9 /100 | #21 | Exceptional 4.8% |
| Carpatho Rusyns | 99.9 /100 | #22 | Exceptional 4.8% |
| Tongans | 99.9 /100 | #23 | Exceptional 4.8% |
| Immigrants | South Central Asia | 99.9 /100 | #24 | Exceptional 4.8% |
| Zimbabweans | 99.9 /100 | #25 | Exceptional 4.8% |
| Dutch | 99.9 /100 | #26 | Exceptional 4.8% |
| Belgians | 99.9 /100 | #27 | Exceptional 4.8% |
| Bulgarians | 99.8 /100 | #28 | Exceptional 4.8% |
| Scottish | 99.8 /100 | #29 | Exceptional 4.8% |
| British | 99.8 /100 | #30 | Exceptional 4.8% |
| Sudanese | 99.8 /100 | #31 | Exceptional 4.8% |
| Immigrants | Nepal | 99.8 /100 | #32 | Exceptional 4.8% |