Pueblo vs Puget Sound Salish Unemployment Among Women with Children Ages 6 to 17 years
COMPARE
Pueblo
Puget Sound Salish
Unemployment Among Women with Children Ages 6 to 17 years
Unemployment Among Women with Children Ages 6 to 17 years Comparison
Pueblo
Puget Sound Salish
8.6%
UNEMPLOYMENT AMONG WOMEN WITH CHILDREN AGES 6 TO 17 YEARS
96.2/ 100
METRIC RATING
118th/ 347
METRIC RANK
7.5%
UNEMPLOYMENT AMONG WOMEN WITH CHILDREN AGES 6 TO 17 YEARS
100.0/ 100
METRIC RATING
15th/ 347
METRIC RANK
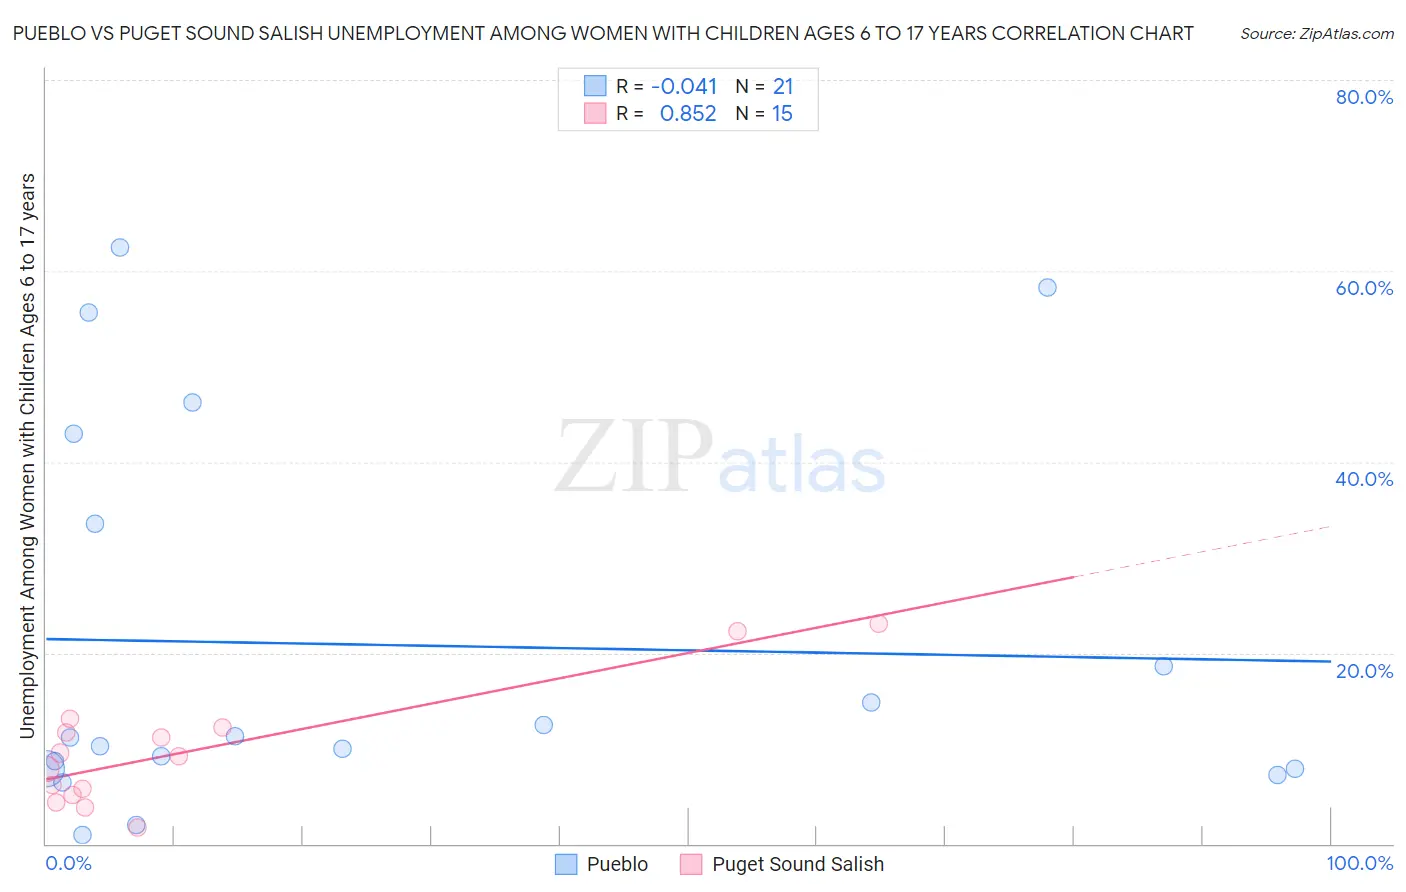
Pueblo vs Puget Sound Salish Unemployment Among Women with Children Ages 6 to 17 years Correlation Chart
The statistical analysis conducted on geographies consisting of 103,975,962 people shows no correlation between the proportion of Pueblo and unemployment rate among women with children between the ages 6 and 17 in the United States with a correlation coefficient (R) of -0.041 and weighted average of 8.6%. Similarly, the statistical analysis conducted on geographies consisting of 40,323,487 people shows a very strong positive correlation between the proportion of Puget Sound Salish and unemployment rate among women with children between the ages 6 and 17 in the United States with a correlation coefficient (R) of 0.852 and weighted average of 7.5%, a difference of 15.5%.
Unemployment Among Women with Children Ages 6 to 17 years Correlation Summary
| Measurement | Pueblo | Puget Sound Salish |
| Minimum | 0.90% | 1.7% |
| Maximum | 62.5% | 23.1% |
| Range | 61.6% | 21.4% |
| Mean | 20.8% | 9.8% |
| Median | 11.1% | 9.1% |
| Interquartile 25% (IQ1) | 7.8% | 5.2% |
| Interquartile 75% (IQ3) | 38.2% | 12.2% |
| Interquartile Range (IQR) | 30.4% | 7.0% |
| Standard Deviation (Sample) | 19.9% | 6.2% |
| Standard Deviation (Population) | 19.4% | 6.0% |
Similar Demographics by Unemployment Among Women with Children Ages 6 to 17 years
Demographics Similar to Pueblo by Unemployment Among Women with Children Ages 6 to 17 years
In terms of unemployment among women with children ages 6 to 17 years, the demographic groups most similar to Pueblo are Immigrants from Grenada (8.6%, a difference of 0.010%), Albanian (8.6%, a difference of 0.030%), Zimbabwean (8.6%, a difference of 0.040%), Israeli (8.7%, a difference of 0.090%), and Argentinean (8.6%, a difference of 0.11%).
| Demographics | Rating | Rank | Unemployment Among Women with Children Ages 6 to 17 years |
| Immigrants | Ukraine | 97.4 /100 | #111 | Exceptional 8.6% |
| Romanians | 97.1 /100 | #112 | Exceptional 8.6% |
| Eastern Europeans | 96.8 /100 | #113 | Exceptional 8.6% |
| Immigrants | Russia | 96.7 /100 | #114 | Exceptional 8.6% |
| Argentineans | 96.5 /100 | #115 | Exceptional 8.6% |
| Zimbabweans | 96.3 /100 | #116 | Exceptional 8.6% |
| Albanians | 96.3 /100 | #117 | Exceptional 8.6% |
| Pueblo | 96.2 /100 | #118 | Exceptional 8.6% |
| Immigrants | Grenada | 96.2 /100 | #119 | Exceptional 8.6% |
| Israelis | 95.9 /100 | #120 | Exceptional 8.7% |
| Immigrants | Denmark | 95.5 /100 | #121 | Exceptional 8.7% |
| Immigrants | Egypt | 95.0 /100 | #122 | Exceptional 8.7% |
| Immigrants | Morocco | 94.9 /100 | #123 | Exceptional 8.7% |
| Immigrants | Lebanon | 94.9 /100 | #124 | Exceptional 8.7% |
| South Africans | 94.6 /100 | #125 | Exceptional 8.7% |
Demographics Similar to Puget Sound Salish by Unemployment Among Women with Children Ages 6 to 17 years
In terms of unemployment among women with children ages 6 to 17 years, the demographic groups most similar to Puget Sound Salish are Immigrants from Burma/Myanmar (7.5%, a difference of 0.36%), Cambodian (7.5%, a difference of 0.54%), Sudanese (7.4%, a difference of 1.1%), Indonesian (7.4%, a difference of 1.1%), and Afghan (7.6%, a difference of 1.2%).
| Demographics | Rating | Rank | Unemployment Among Women with Children Ages 6 to 17 years |
| Immigrants | Hong Kong | 100.0 /100 | #8 | Exceptional 7.2% |
| Assyrians/Chaldeans/Syriacs | 100.0 /100 | #9 | Exceptional 7.2% |
| Immigrants | Fiji | 100.0 /100 | #10 | Exceptional 7.3% |
| Immigrants | Taiwan | 100.0 /100 | #11 | Exceptional 7.3% |
| Bangladeshis | 100.0 /100 | #12 | Exceptional 7.4% |
| Indonesians | 100.0 /100 | #13 | Exceptional 7.4% |
| Sudanese | 100.0 /100 | #14 | Exceptional 7.4% |
| Puget Sound Salish | 100.0 /100 | #15 | Exceptional 7.5% |
| Immigrants | Burma/Myanmar | 100.0 /100 | #16 | Exceptional 7.5% |
| Cambodians | 100.0 /100 | #17 | Exceptional 7.5% |
| Afghans | 100.0 /100 | #18 | Exceptional 7.6% |
| Filipinos | 100.0 /100 | #19 | Exceptional 7.6% |
| Immigrants | Singapore | 100.0 /100 | #20 | Exceptional 7.7% |
| Immigrants | India | 100.0 /100 | #21 | Exceptional 7.7% |
| Immigrants | China | 100.0 /100 | #22 | Exceptional 7.7% |