Peruvian vs Slovak Unemployment Among Seniors over 65 years
COMPARE
Peruvian
Slovak
Unemployment Among Seniors over 65 years
Unemployment Among Seniors over 65 years Comparison
Peruvians
Slovaks
5.3%
UNEMPLOYMENT AMONG SENIORS OVER 65 YEARS
0.8/ 100
METRIC RATING
244th/ 347
METRIC RANK
5.1%
UNEMPLOYMENT AMONG SENIORS OVER 65 YEARS
77.9/ 100
METRIC RATING
147th/ 347
METRIC RANK
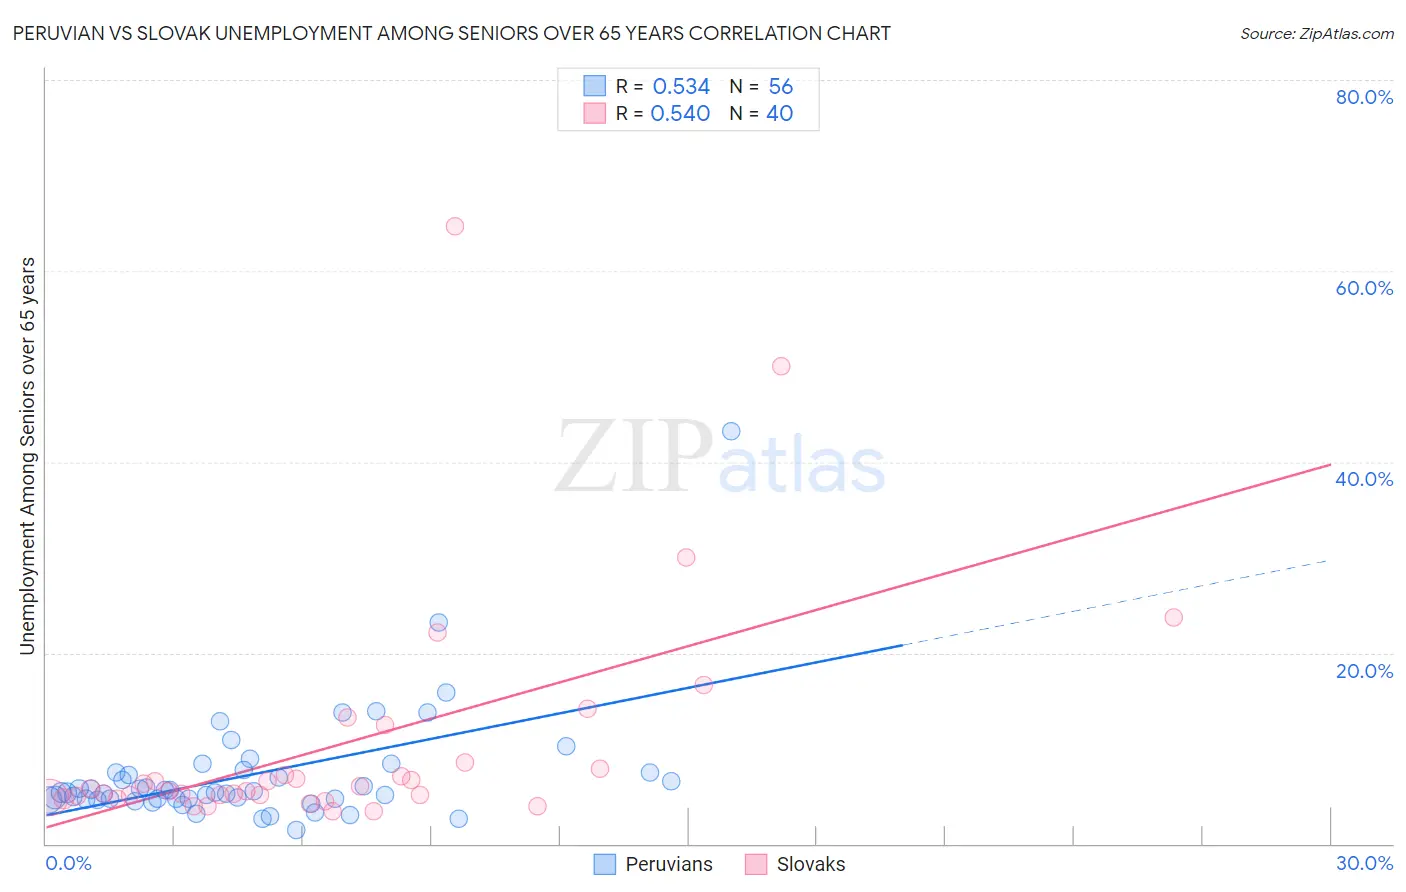
Peruvian vs Slovak Unemployment Among Seniors over 65 years Correlation Chart
The statistical analysis conducted on geographies consisting of 333,726,313 people shows a substantial positive correlation between the proportion of Peruvians and unemployment rate amomg seniors over the age of 65 in the United States with a correlation coefficient (R) of 0.534 and weighted average of 5.3%. Similarly, the statistical analysis conducted on geographies consisting of 353,078,029 people shows a substantial positive correlation between the proportion of Slovaks and unemployment rate amomg seniors over the age of 65 in the United States with a correlation coefficient (R) of 0.540 and weighted average of 5.1%, a difference of 4.9%.
Unemployment Among Seniors over 65 years Correlation Summary
| Measurement | Peruvian | Slovak |
| Minimum | 1.4% | 3.4% |
| Maximum | 43.2% | 64.7% |
| Range | 41.8% | 61.3% |
| Mean | 7.2% | 10.4% |
| Median | 5.4% | 5.7% |
| Interquartile 25% (IQ1) | 4.7% | 4.9% |
| Interquartile 75% (IQ3) | 7.5% | 8.1% |
| Interquartile Range (IQR) | 2.8% | 3.2% |
| Standard Deviation (Sample) | 6.2% | 12.5% |
| Standard Deviation (Population) | 6.1% | 12.3% |
Similar Demographics by Unemployment Among Seniors over 65 years
Demographics Similar to Peruvians by Unemployment Among Seniors over 65 years
In terms of unemployment among seniors over 65 years, the demographic groups most similar to Peruvians are Ottawa (5.3%, a difference of 0.010%), Colombian (5.3%, a difference of 0.040%), Immigrants from Caribbean (5.3%, a difference of 0.080%), Nigerian (5.3%, a difference of 0.10%), and Bahamian (5.3%, a difference of 0.13%).
| Demographics | Rating | Rank | Unemployment Among Seniors over 65 years |
| Immigrants | Greece | 2.0 /100 | #237 | Tragic 5.3% |
| Immigrants | Israel | 2.0 /100 | #238 | Tragic 5.3% |
| Immigrants | Senegal | 1.8 /100 | #239 | Tragic 5.3% |
| Immigrants | Trinidad and Tobago | 1.6 /100 | #240 | Tragic 5.3% |
| Apache | 1.3 /100 | #241 | Tragic 5.3% |
| Bahamians | 0.9 /100 | #242 | Tragic 5.3% |
| Nigerians | 0.9 /100 | #243 | Tragic 5.3% |
| Peruvians | 0.8 /100 | #244 | Tragic 5.3% |
| Ottawa | 0.8 /100 | #245 | Tragic 5.3% |
| Colombians | 0.7 /100 | #246 | Tragic 5.3% |
| Immigrants | Caribbean | 0.7 /100 | #247 | Tragic 5.3% |
| French Canadians | 0.7 /100 | #248 | Tragic 5.4% |
| Immigrants | Immigrants | 0.6 /100 | #249 | Tragic 5.4% |
| Ghanaians | 0.6 /100 | #250 | Tragic 5.4% |
| West Indians | 0.6 /100 | #251 | Tragic 5.4% |
Demographics Similar to Slovaks by Unemployment Among Seniors over 65 years
In terms of unemployment among seniors over 65 years, the demographic groups most similar to Slovaks are Immigrants from Russia (5.1%, a difference of 0.030%), Greek (5.1%, a difference of 0.040%), Spanish (5.1%, a difference of 0.050%), Immigrants from Afghanistan (5.1%, a difference of 0.050%), and Immigrants from Asia (5.1%, a difference of 0.10%).
| Demographics | Rating | Rank | Unemployment Among Seniors over 65 years |
| Immigrants | Chile | 83.0 /100 | #140 | Excellent 5.1% |
| Cherokee | 81.6 /100 | #141 | Excellent 5.1% |
| Immigrants | Indonesia | 81.0 /100 | #142 | Excellent 5.1% |
| Senegalese | 80.4 /100 | #143 | Excellent 5.1% |
| Poles | 80.3 /100 | #144 | Excellent 5.1% |
| Spanish | 78.8 /100 | #145 | Good 5.1% |
| Immigrants | Russia | 78.5 /100 | #146 | Good 5.1% |
| Slovaks | 77.9 /100 | #147 | Good 5.1% |
| Greeks | 77.0 /100 | #148 | Good 5.1% |
| Immigrants | Afghanistan | 76.8 /100 | #149 | Good 5.1% |
| Immigrants | Asia | 75.6 /100 | #150 | Good 5.1% |
| Pakistanis | 75.5 /100 | #151 | Good 5.1% |
| Canadians | 74.7 /100 | #152 | Good 5.1% |
| Immigrants | Czechoslovakia | 74.5 /100 | #153 | Good 5.1% |
| Immigrants | Hong Kong | 74.0 /100 | #154 | Good 5.1% |