Peruvian vs Panamanian Unemployment Among Seniors over 65 years

COMPARE

Peruvian
Race
Ancestry
AfghanAfricanAlaska NativeAlaskan AthabascanAlbanianAleutAlsatianAmericanApacheArabArapahoArgentineanArmenianAssyrian/Chaldean/SyriacAustralianAustrianBahamianBangladeshiBarbadianBasqueBelgianBelizeanBermudanBhutaneseBlackfeetBolivianBrazilianBritishBritish West IndianBulgarianBurmeseCajunCambodianCanadianCape VerdeanCarpatho RusynCelticCentral AmericanCentral American IndianCherokeeCheyenneChickasawChileanChineseChippewaChoctawColombianColvilleComancheCosta RicanCreeCreekCroatianCrowCubanCypriotCzechCzechoslovakianDanishDelawareDominicanDutchDutch West IndianEastern EuropeanEcuadorianEgyptianEnglishEstonianEthiopianEuropeanFijianFilipinoFinnishFrenchFrench American IndianFrench CanadianGermanGerman RussianGhanaianGreekGuamanian/ChamorroGuatemalanGuyaneseHaitianHmongHonduranHopiHoumaHungarianIcelanderIndian (Asian)IndonesianInupiatIranianIraqiIrishIroquoisIsraeliItalianJamaicanJapaneseJordanianKenyanKiowaKoreanLaotianLatvianLebaneseLiberianLithuanianLumbeeLuxembourgerMacedonianMalaysianMalteseMarshalleseMenomineeMexicanMexican American IndianMongolianMoroccanNative HawaiianNavajoNepaleseNew ZealanderNicaraguanNigerianNorthern EuropeanNorwegianOkinawanOsageOttawaPaiutePakistaniPalestinianParaguayanPennsylvania GermanPeruvianPimaPolishPortuguesePotawatomiPuebloPuerto RicanPuget Sound SalishRomanianRussianSalvadoranSamoanScandinavianScotch-IrishScottishSeminoleSenegaleseSerbianShoshoneSierra LeoneanSiouxSlavicSlovakSloveneSomaliSouth AfricanSouth AmericanSouth American IndianSoviet UnionSpaniardSpanishSpanish AmericanSpanish American IndianSri LankanSubsaharan AfricanSudaneseSwedishSwissSyrianTaiwaneseThaiTlingit-HaidaTohono O'OdhamTonganTrinidadian and TobagonianTsimshianTurkishU.S. Virgin IslanderUgandanUkrainianUruguayanUteVenezuelanVietnameseWelshWest IndianYakamaYaquiYugoslavianYumanYup'ikZimbabwean
Immigration
NonimmigrantsImmigrantsAfghanistanAfricaAlbaniaArgentinaArmeniaAsiaAustraliaAustriaBahamasBangladeshBarbadosBelarusBelgiumBelizeBoliviaBosnia and HerzegovinaBrazilBulgariaBurma/MyanmarCabo VerdeCambodiaCameroonCanadaCaribbeanCentral AmericaChileChinaColombiaCongoCosta RicaCroatiaCubaCzechoslovakiaDenmarkDominicaDominican RepublicEastern AfricaEastern AsiaEastern EuropeEcuadorEgyptEl SalvadorEnglandEritreaEthiopiaEuropeFijiFranceGermanyGhanaGreeceGrenadaGuatemalaGuyanaHaitiHondurasHong KongHungaryIndiaIndonesiaIranIraqIrelandIsraelItalyJamaicaJapanJordanKazakhstanKenyaKoreaKuwaitLaosLatin AmericaLatviaLebanonLiberiaLithuaniaMalaysiaMexicoMicronesiaMiddle AfricaMoldovaMoroccoNepalNetherlandsNicaraguaNigeriaNorth AmericaNorth MacedoniaNorthern AfricaNorthern EuropeNorwayOceaniaPakistanPanamaPeruPhilippinesPolandPortugalRomaniaRussiaSaudi ArabiaScotlandSenegalSerbiaSierra LeoneSingaporeSomaliaSouth AfricaSouth AmericaSouth Central AsiaSouth Eastern AsiaSouthern EuropeSpainSri LankaSt. Vincent and the GrenadinesSudanSwedenSwitzerlandSyriaTaiwanThailandTrinidad and TobagoTurkeyUgandaUkraineUruguayUzbekistanVenezuelaVietnamWest IndiesWestern AfricaWestern AsiaWestern EuropeYemenZaireZimbabweAzores
Panamanian
Race
Ancestry
AfghanAfricanAlaska NativeAlaskan AthabascanAlbanianAleutAlsatianAmericanApacheArabArapahoArgentineanArmenianAssyrian/Chaldean/SyriacAustralianAustrianBahamianBangladeshiBarbadianBasqueBelgianBelizeanBermudanBhutaneseBlackfeetBolivianBrazilianBritishBritish West IndianBulgarianBurmeseCajunCambodianCanadianCape VerdeanCarpatho RusynCelticCentral AmericanCentral American IndianCherokeeCheyenneChickasawChileanChineseChippewaChoctawColombianColvilleComancheCosta RicanCreeCreekCroatianCrowCubanCypriotCzechCzechoslovakianDanishDelawareDominicanDutchDutch West IndianEastern EuropeanEcuadorianEgyptianEnglishEstonianEthiopianEuropeanFijianFilipinoFinnishFrenchFrench American IndianFrench CanadianGermanGerman RussianGhanaianGreekGuamanian/ChamorroGuatemalanGuyaneseHaitianHmongHonduranHopiHoumaHungarianIcelanderIndian (Asian)IndonesianInupiatIranianIraqiIrishIroquoisIsraeliItalianJamaicanJapaneseJordanianKenyanKiowaKoreanLaotianLatvianLebaneseLiberianLithuanianLumbeeLuxembourgerMacedonianMalaysianMalteseMarshalleseMenomineeMexicanMexican American IndianMongolianMoroccanNative HawaiianNavajoNepaleseNew ZealanderNicaraguanNigerianNorthern EuropeanNorwegianOkinawanOsageOttawaPaiutePakistaniPalestinianPanamanianParaguayanPennsylvania GermanPimaPolishPortuguesePotawatomiPuebloPuerto RicanPuget Sound SalishRomanianRussianSalvadoranSamoanScandinavianScotch-IrishScottishSeminoleSenegaleseSerbianShoshoneSierra LeoneanSiouxSlavicSlovakSloveneSomaliSouth AfricanSouth AmericanSouth American IndianSoviet UnionSpaniardSpanishSpanish AmericanSpanish American IndianSri LankanSubsaharan AfricanSudaneseSwedishSwissSyrianTaiwaneseThaiTlingit-HaidaTohono O'OdhamTonganTrinidadian and TobagonianTsimshianTurkishU.S. Virgin IslanderUgandanUkrainianUruguayanUteVenezuelanVietnameseWelshWest IndianYakamaYaquiYugoslavianYumanYup'ikZimbabwean
Immigration
NonimmigrantsImmigrantsAfghanistanAfricaAlbaniaArgentinaArmeniaAsiaAustraliaAustriaBahamasBangladeshBarbadosBelarusBelgiumBelizeBoliviaBosnia and HerzegovinaBrazilBulgariaBurma/MyanmarCabo VerdeCambodiaCameroonCanadaCaribbeanCentral AmericaChileChinaColombiaCongoCosta RicaCroatiaCubaCzechoslovakiaDenmarkDominicaDominican RepublicEastern AfricaEastern AsiaEastern EuropeEcuadorEgyptEl SalvadorEnglandEritreaEthiopiaEuropeFijiFranceGermanyGhanaGreeceGrenadaGuatemalaGuyanaHaitiHondurasHong KongHungaryIndiaIndonesiaIranIraqIrelandIsraelItalyJamaicaJapanJordanKazakhstanKenyaKoreaKuwaitLaosLatin AmericaLatviaLebanonLiberiaLithuaniaMalaysiaMexicoMicronesiaMiddle AfricaMoldovaMoroccoNepalNetherlandsNicaraguaNigeriaNorth AmericaNorth MacedoniaNorthern AfricaNorthern EuropeNorwayOceaniaPakistanPanamaPeruPhilippinesPolandPortugalRomaniaRussiaSaudi ArabiaScotlandSenegalSerbiaSierra LeoneSingaporeSomaliaSouth AfricaSouth AmericaSouth Central AsiaSouth Eastern AsiaSouthern EuropeSpainSri LankaSt. Vincent and the GrenadinesSudanSwedenSwitzerlandSyriaTaiwanThailandTrinidad and TobagoTurkeyUgandaUkraineUruguayUzbekistanVenezuelaVietnamWest IndiesWestern AfricaWestern AsiaWestern EuropeYemenZaireZimbabweAzores
Unemployment Among Seniors over 65 years
Income
Poverty
Unemployment
Labor Participation
Family Structure
Vehicle Availability
Education Level
Disability

Unemployment Among Seniors over 65 years Comparison

Peruvians

Panamanians

Tragic
Average
5.3%
UNEMPLOYMENT AMONG SENIORS OVER 65 YEARS
0.8/ 100
METRIC RATING
244th/ 347
METRIC RANK
5.2%
UNEMPLOYMENT AMONG SENIORS OVER 65 YEARS
43.0/ 100
METRIC RATING
182nd/ 347
METRIC RANK

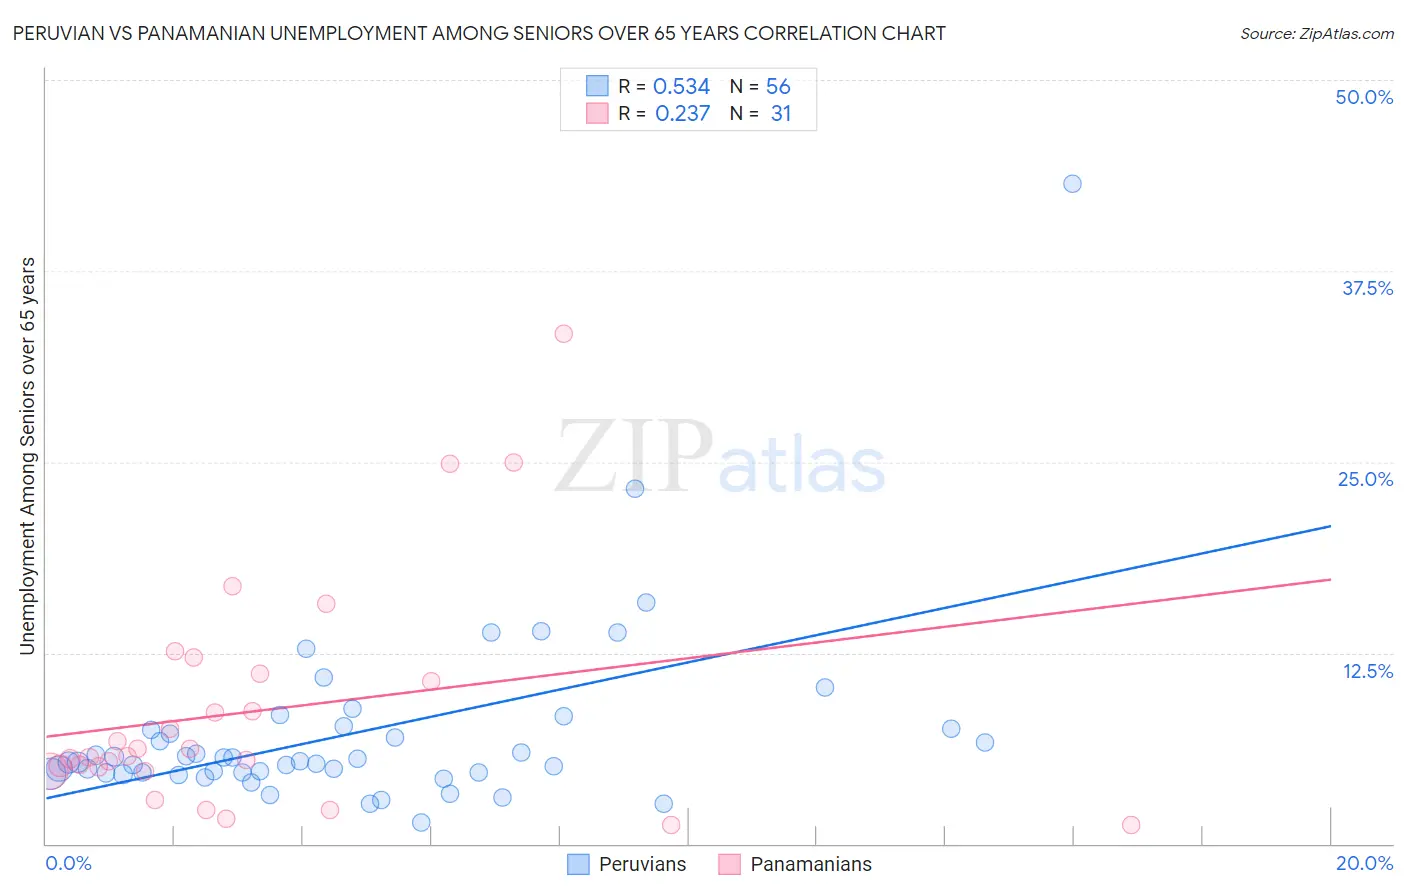
Peruvian vs Panamanian Unemployment Among Seniors over 65 years Correlation Chart

The statistical analysis conducted on geographies consisting of 333,726,313 people shows a substantial positive correlation between the proportion of Peruvians and unemployment rate amomg seniors over the age of 65 in the United States with a correlation coefficient (R) of 0.534 and weighted average of 5.3%. Similarly, the statistical analysis conducted on geographies consisting of 261,913,860 people shows a weak positive correlation between the proportion of Panamanians and unemployment rate amomg seniors over the age of 65 in the United States with a correlation coefficient (R) of 0.237 and weighted average of 5.2%, a difference of 3.6%.
Peruvian vs Panamanian Unemployment Among Seniors over 65 years

Unemployment Among Seniors over 65 years Correlation Summary

MeasurementPeruvianPanamanian
Minimum1.4%1.2%
Maximum43.2%33.4%
Range41.8%32.2%
Mean7.2%8.7%
Median5.4%5.7%
Interquartile 25% (IQ1)4.7%4.8%
Interquartile 75% (IQ3)7.5%11.1%
Interquartile Range (IQR)2.8%6.4%
Standard Deviation (Sample)6.2%7.5%
Standard Deviation (Population)6.1%7.4%

Similar Demographics by Unemployment Among Seniors over 65 years

Demographics Similar to Peruvians by Unemployment Among Seniors over 65 years

In terms of unemployment among seniors over 65 years, the demographic groups most similar to Peruvians are Ottawa (5.3%, a difference of 0.010%), Colombian (5.3%, a difference of 0.040%), Immigrants from Caribbean (5.3%, a difference of 0.080%), Nigerian (5.3%, a difference of 0.10%), and Bahamian (5.3%, a difference of 0.13%).
DemographicsRating | RankUnemployment Among Seniors over 65 years
Immigrants | Greece
2.0
/100
|
#237
Tragic
5.3%
Immigrants | Israel
2.0
/100
|
#238
Tragic
5.3%
Immigrants | Senegal
1.8
/100
|
#239
Tragic
5.3%
Immigrants | Trinidad and Tobago
1.6
/100
|
#240
Tragic
5.3%
Apache
1.3
/100
|
#241
Tragic
5.3%
Bahamians
0.9
/100
|
#242
Tragic
5.3%
Nigerians
0.9
/100
|
#243
Tragic
5.3%
Peruvians
0.8
/100
|
#244
Tragic
5.3%
Ottawa
0.8
/100
|
#245
Tragic
5.3%
Colombians
0.7
/100
|
#246
Tragic
5.3%
Immigrants | Caribbean
0.7
/100
|
#247
Tragic
5.3%
French Canadians
0.7
/100
|
#248
Tragic
5.4%
Immigrants | Immigrants
0.6
/100
|
#249
Tragic
5.4%
Ghanaians
0.6
/100
|
#250
Tragic
5.4%
West Indians
0.6
/100
|
#251
Tragic
5.4%

Demographics Similar to Panamanians by Unemployment Among Seniors over 65 years

In terms of unemployment among seniors over 65 years, the demographic groups most similar to Panamanians are Immigrants from Italy (5.2%, a difference of 0.010%), Russian (5.2%, a difference of 0.020%), Immigrants from Somalia (5.2%, a difference of 0.030%), Immigrants from Western Asia (5.2%, a difference of 0.030%), and Immigrants from Serbia (5.2%, a difference of 0.050%).
DemographicsRating | RankUnemployment Among Seniors over 65 years
Immigrants | Eastern Europe
49.8
/100
|
#175
Average
5.1%
Indians (Asian)
46.6
/100
|
#176
Average
5.2%
Icelanders
45.9
/100
|
#177
Average
5.2%
Immigrants | Belgium
44.8
/100
|
#178
Average
5.2%
Immigrants | Somalia
44.0
/100
|
#179
Average
5.2%
Russians
43.6
/100
|
#180
Average
5.2%
Immigrants | Italy
43.5
/100
|
#181
Average
5.2%
Panamanians
43.0
/100
|
#182
Average
5.2%
Immigrants | Western Asia
42.1
/100
|
#183
Average
5.2%
Immigrants | Serbia
41.6
/100
|
#184
Average
5.2%
Immigrants | Iran
36.0
/100
|
#185
Fair
5.2%
Americans
35.1
/100
|
#186
Fair
5.2%
Somalis
33.5
/100
|
#187
Fair
5.2%
Immigrants | Egypt
33.2
/100
|
#188
Fair
5.2%
Bangladeshis
32.3
/100
|
#189
Fair
5.2%