Panamanian vs White/Caucasian Unemployment Among Ages 25 to 29 years
COMPARE
Panamanian
White/Caucasian
Unemployment Among Ages 25 to 29 years
Unemployment Among Ages 25 to 29 years Comparison
Panamanians
Whites/Caucasians
7.0%
UNEMPLOYMENT AMONG AGES 25 TO 29 YEARS
2.1/ 100
METRIC RATING
235th/ 347
METRIC RANK
6.9%
UNEMPLOYMENT AMONG AGES 25 TO 29 YEARS
10.6/ 100
METRIC RATING
219th/ 347
METRIC RANK
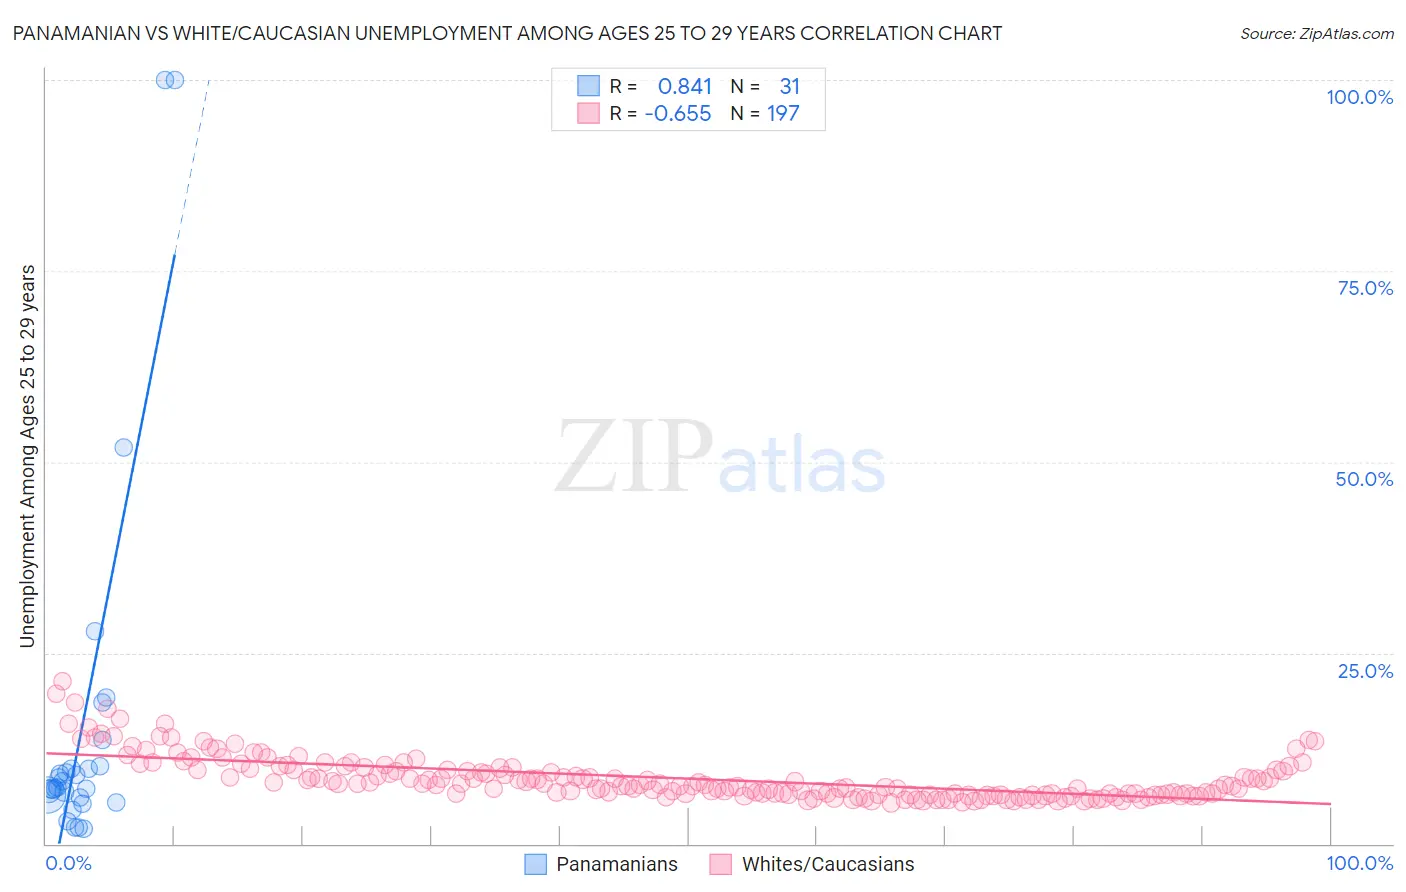
Panamanian vs White/Caucasian Unemployment Among Ages 25 to 29 years Correlation Chart
The statistical analysis conducted on geographies consisting of 273,620,006 people shows a very strong positive correlation between the proportion of Panamanians and unemployment rate among population between the ages 25 and 29 in the United States with a correlation coefficient (R) of 0.841 and weighted average of 7.0%. Similarly, the statistical analysis conducted on geographies consisting of 513,309,764 people shows a significant negative correlation between the proportion of Whites/Caucasians and unemployment rate among population between the ages 25 and 29 in the United States with a correlation coefficient (R) of -0.655 and weighted average of 6.9%, a difference of 2.5%.
Unemployment Among Ages 25 to 29 years Correlation Summary
| Measurement | Panamanian | White/Caucasian |
| Minimum | 2.0% | 5.3% |
| Maximum | 100.0% | 21.2% |
| Range | 98.0% | 15.9% |
| Mean | 15.9% | 8.5% |
| Median | 7.4% | 7.7% |
| Interquartile 25% (IQ1) | 6.0% | 6.5% |
| Interquartile 75% (IQ3) | 10.1% | 9.8% |
| Interquartile Range (IQR) | 4.1% | 3.3% |
| Standard Deviation (Sample) | 24.3% | 2.9% |
| Standard Deviation (Population) | 24.0% | 2.9% |
Demographics Similar to Panamanians and Whites/Caucasians by Unemployment Among Ages 25 to 29 years
In terms of unemployment among ages 25 to 29 years, the demographic groups most similar to Panamanians are Cape Verdean (7.0%, a difference of 0.14%), French Canadian (7.0%, a difference of 0.16%), Immigrants from Honduras (7.0%, a difference of 0.18%), Puget Sound Salish (7.1%, a difference of 0.21%), and Spanish American (7.0%, a difference of 0.37%). Similarly, the demographic groups most similar to Whites/Caucasians are French (6.9%, a difference of 0.010%), Israeli (6.9%, a difference of 0.13%), Immigrants from Austria (6.8%, a difference of 0.26%), Ute (6.8%, a difference of 0.40%), and Spaniard (6.9%, a difference of 0.52%).
| Demographics | Rating | Rank | Unemployment Among Ages 25 to 29 years |
| Ute | 13.4 /100 | #217 | Poor 6.8% |
| Immigrants | Austria | 12.3 /100 | #218 | Poor 6.8% |
| Whites/Caucasians | 10.6 /100 | #219 | Poor 6.9% |
| French | 10.5 /100 | #220 | Poor 6.9% |
| Israelis | 9.8 /100 | #221 | Tragic 6.9% |
| Spaniards | 7.7 /100 | #222 | Tragic 6.9% |
| Celtics | 7.6 /100 | #223 | Tragic 6.9% |
| Immigrants | Immigrants | 6.2 /100 | #224 | Tragic 6.9% |
| Japanese | 5.4 /100 | #225 | Tragic 6.9% |
| Immigrants | Liberia | 4.8 /100 | #226 | Tragic 7.0% |
| Salvadorans | 4.4 /100 | #227 | Tragic 7.0% |
| Immigrants | Panama | 4.2 /100 | #228 | Tragic 7.0% |
| Bermudans | 3.8 /100 | #229 | Tragic 7.0% |
| Immigrants | El Salvador | 3.6 /100 | #230 | Tragic 7.0% |
| Central Americans | 3.0 /100 | #231 | Tragic 7.0% |
| Spanish Americans | 2.7 /100 | #232 | Tragic 7.0% |
| Immigrants | Honduras | 2.4 /100 | #233 | Tragic 7.0% |
| French Canadians | 2.4 /100 | #234 | Tragic 7.0% |
| Panamanians | 2.1 /100 | #235 | Tragic 7.0% |
| Cape Verdeans | 1.9 /100 | #236 | Tragic 7.0% |
| Puget Sound Salish | 1.8 /100 | #237 | Tragic 7.1% |