Panamanian vs Australian Unemployment Among Ages 25 to 29 years
COMPARE
Panamanian
Australian
Unemployment Among Ages 25 to 29 years
Unemployment Among Ages 25 to 29 years Comparison
Panamanians
Australians
7.0%
UNEMPLOYMENT AMONG AGES 25 TO 29 YEARS
2.1/ 100
METRIC RATING
235th/ 347
METRIC RANK
6.4%
UNEMPLOYMENT AMONG AGES 25 TO 29 YEARS
93.6/ 100
METRIC RATING
93rd/ 347
METRIC RANK
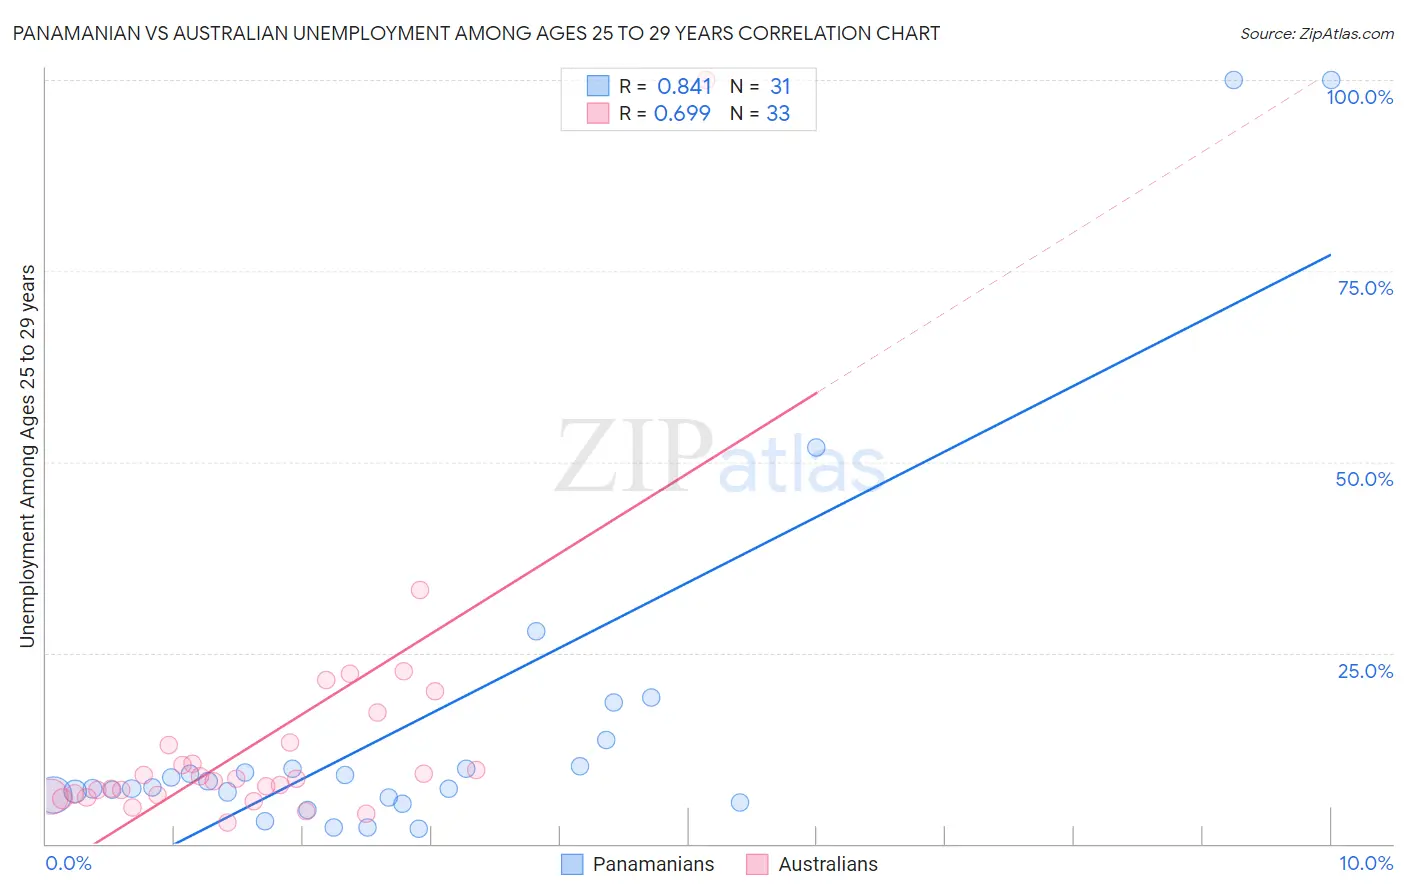
Panamanian vs Australian Unemployment Among Ages 25 to 29 years Correlation Chart
The statistical analysis conducted on geographies consisting of 273,620,006 people shows a very strong positive correlation between the proportion of Panamanians and unemployment rate among population between the ages 25 and 29 in the United States with a correlation coefficient (R) of 0.841 and weighted average of 7.0%. Similarly, the statistical analysis conducted on geographies consisting of 216,520,214 people shows a significant positive correlation between the proportion of Australians and unemployment rate among population between the ages 25 and 29 in the United States with a correlation coefficient (R) of 0.699 and weighted average of 6.4%, a difference of 10.5%.
Unemployment Among Ages 25 to 29 years Correlation Summary
| Measurement | Panamanian | Australian |
| Minimum | 2.0% | 2.8% |
| Maximum | 100.0% | 100.0% |
| Range | 98.0% | 97.2% |
| Mean | 15.9% | 13.2% |
| Median | 7.4% | 8.4% |
| Interquartile 25% (IQ1) | 6.0% | 6.3% |
| Interquartile 75% (IQ3) | 10.1% | 13.1% |
| Interquartile Range (IQR) | 4.1% | 6.8% |
| Standard Deviation (Sample) | 24.3% | 17.0% |
| Standard Deviation (Population) | 24.0% | 16.7% |
Similar Demographics by Unemployment Among Ages 25 to 29 years
Demographics Similar to Panamanians by Unemployment Among Ages 25 to 29 years
In terms of unemployment among ages 25 to 29 years, the demographic groups most similar to Panamanians are Cape Verdean (7.0%, a difference of 0.14%), French Canadian (7.0%, a difference of 0.16%), Immigrants from Honduras (7.0%, a difference of 0.18%), Puget Sound Salish (7.1%, a difference of 0.21%), and Honduran (7.1%, a difference of 0.23%).
| Demographics | Rating | Rank | Unemployment Among Ages 25 to 29 years |
| Immigrants | Panama | 4.2 /100 | #228 | Tragic 7.0% |
| Bermudans | 3.8 /100 | #229 | Tragic 7.0% |
| Immigrants | El Salvador | 3.6 /100 | #230 | Tragic 7.0% |
| Central Americans | 3.0 /100 | #231 | Tragic 7.0% |
| Spanish Americans | 2.7 /100 | #232 | Tragic 7.0% |
| Immigrants | Honduras | 2.4 /100 | #233 | Tragic 7.0% |
| French Canadians | 2.4 /100 | #234 | Tragic 7.0% |
| Panamanians | 2.1 /100 | #235 | Tragic 7.0% |
| Cape Verdeans | 1.9 /100 | #236 | Tragic 7.0% |
| Puget Sound Salish | 1.8 /100 | #237 | Tragic 7.1% |
| Hondurans | 1.8 /100 | #238 | Tragic 7.1% |
| Potawatomi | 1.3 /100 | #239 | Tragic 7.1% |
| Native Hawaiians | 1.3 /100 | #240 | Tragic 7.1% |
| Immigrants | Sierra Leone | 1.3 /100 | #241 | Tragic 7.1% |
| Spanish American Indians | 1.1 /100 | #242 | Tragic 7.1% |
Demographics Similar to Australians by Unemployment Among Ages 25 to 29 years
In terms of unemployment among ages 25 to 29 years, the demographic groups most similar to Australians are Immigrants from North Macedonia (6.4%, a difference of 0.0%), Zimbabwean (6.4%, a difference of 0.050%), Egyptian (6.4%, a difference of 0.060%), Lebanese (6.4%, a difference of 0.070%), and Immigrants from Oceania (6.4%, a difference of 0.14%).
| Demographics | Rating | Rank | Unemployment Among Ages 25 to 29 years |
| Immigrants | Asia | 94.9 /100 | #86 | Exceptional 6.3% |
| Marshallese | 94.7 /100 | #87 | Exceptional 6.4% |
| Immigrants | Indonesia | 94.5 /100 | #88 | Exceptional 6.4% |
| Immigrants | Oceania | 94.1 /100 | #89 | Exceptional 6.4% |
| Lebanese | 93.9 /100 | #90 | Exceptional 6.4% |
| Egyptians | 93.9 /100 | #91 | Exceptional 6.4% |
| Immigrants | North Macedonia | 93.6 /100 | #92 | Exceptional 6.4% |
| Australians | 93.6 /100 | #93 | Exceptional 6.4% |
| Zimbabweans | 93.5 /100 | #94 | Exceptional 6.4% |
| Afghans | 92.5 /100 | #95 | Exceptional 6.4% |
| Immigrants | Brazil | 92.1 /100 | #96 | Exceptional 6.4% |
| Immigrants | Eastern Europe | 91.9 /100 | #97 | Exceptional 6.4% |
| Serbians | 91.7 /100 | #98 | Exceptional 6.4% |
| Iraqis | 91.3 /100 | #99 | Exceptional 6.4% |
| Uruguayans | 91.2 /100 | #100 | Exceptional 6.4% |