Panamanian vs Estonian Unemployment Among Ages 45 to 54 years
COMPARE
Panamanian
Estonian
Unemployment Among Ages 45 to 54 years
Unemployment Among Ages 45 to 54 years Comparison
Panamanians
Estonians
4.6%
UNEMPLOYMENT AMONG AGES 45 TO 54 YEARS
10.7/ 100
METRIC RATING
213th/ 347
METRIC RANK
4.6%
UNEMPLOYMENT AMONG AGES 45 TO 54 YEARS
31.2/ 100
METRIC RATING
196th/ 347
METRIC RANK
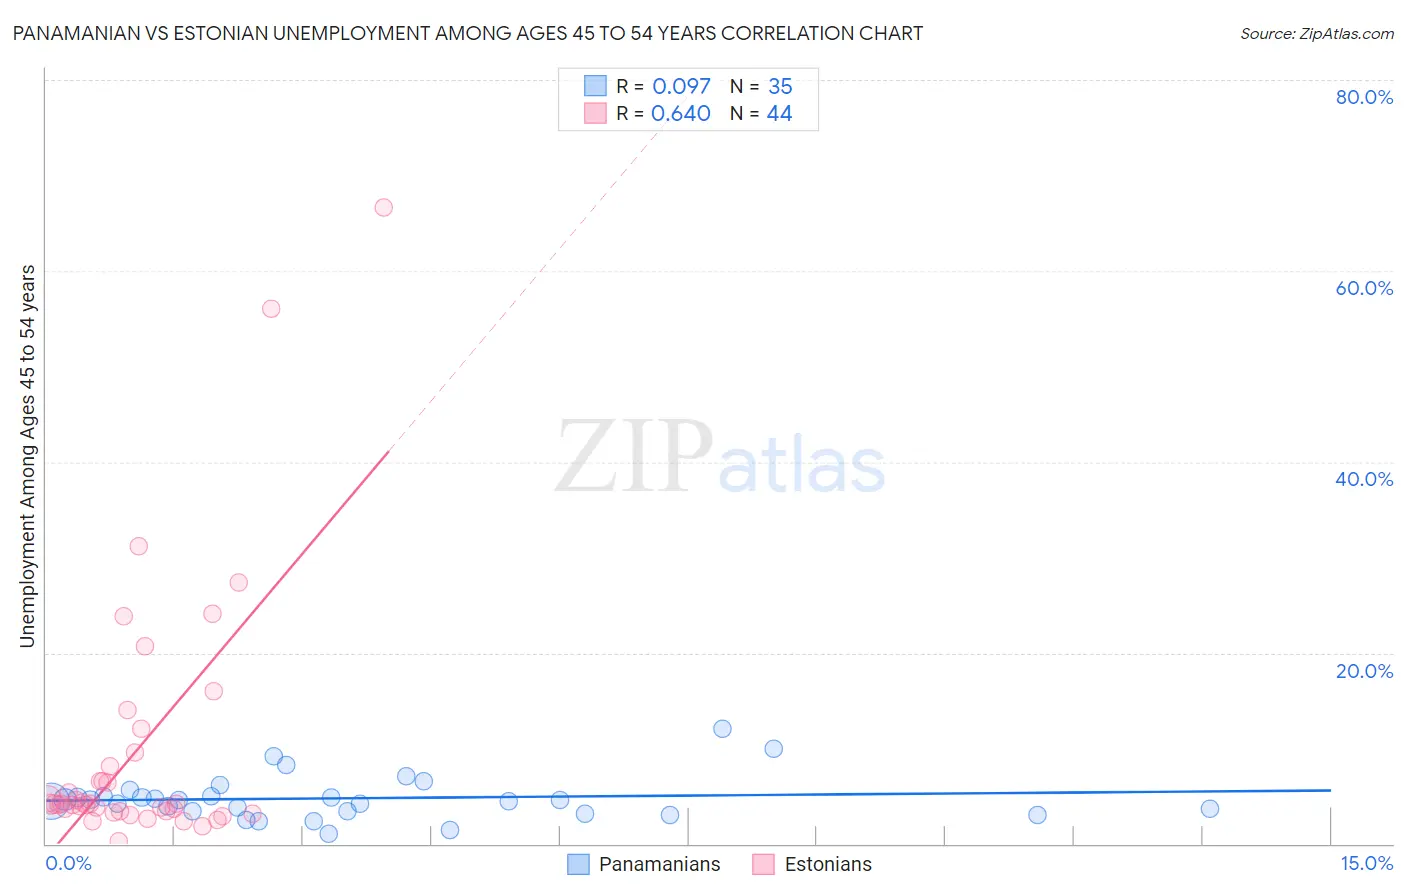
Panamanian vs Estonian Unemployment Among Ages 45 to 54 years Correlation Chart
The statistical analysis conducted on geographies consisting of 277,014,987 people shows a slight positive correlation between the proportion of Panamanians and unemployment rate among population between the ages 45 and 54 in the United States with a correlation coefficient (R) of 0.097 and weighted average of 4.6%. Similarly, the statistical analysis conducted on geographies consisting of 122,283,099 people shows a significant positive correlation between the proportion of Estonians and unemployment rate among population between the ages 45 and 54 in the United States with a correlation coefficient (R) of 0.640 and weighted average of 4.6%, a difference of 1.5%.
Unemployment Among Ages 45 to 54 years Correlation Summary
| Measurement | Panamanian | Estonian |
| Minimum | 1.1% | 0.30% |
| Maximum | 12.1% | 66.7% |
| Range | 11.0% | 66.4% |
| Mean | 4.8% | 9.8% |
| Median | 4.6% | 4.2% |
| Interquartile 25% (IQ1) | 3.4% | 3.4% |
| Interquartile 75% (IQ3) | 4.9% | 8.8% |
| Interquartile Range (IQR) | 1.6% | 5.4% |
| Standard Deviation (Sample) | 2.3% | 13.6% |
| Standard Deviation (Population) | 2.3% | 13.4% |
Demographics Similar to Panamanians and Estonians by Unemployment Among Ages 45 to 54 years
In terms of unemployment among ages 45 to 54 years, the demographic groups most similar to Panamanians are Cherokee (4.6%, a difference of 0.020%), Immigrants from Iran (4.6%, a difference of 0.090%), Creek (4.6%, a difference of 0.13%), Immigrants from South America (4.6%, a difference of 0.17%), and Immigrants from Nigeria (4.6%, a difference of 0.27%). Similarly, the demographic groups most similar to Estonians are Albanian (4.6%, a difference of 0.010%), Peruvian (4.6%, a difference of 0.020%), Immigrants from Belarus (4.6%, a difference of 0.030%), South American (4.6%, a difference of 0.090%), and Brazilian (4.6%, a difference of 0.68%).
| Demographics | Rating | Rank | Unemployment Among Ages 45 to 54 years |
| South Americans | 32.9 /100 | #194 | Fair 4.6% |
| Peruvians | 31.5 /100 | #195 | Fair 4.6% |
| Estonians | 31.2 /100 | #196 | Fair 4.6% |
| Albanians | 31.1 /100 | #197 | Fair 4.6% |
| Immigrants | Belarus | 30.6 /100 | #198 | Fair 4.6% |
| Brazilians | 20.1 /100 | #199 | Fair 4.6% |
| Immigrants | Denmark | 19.8 /100 | #200 | Poor 4.6% |
| Immigrants | Costa Rica | 19.7 /100 | #201 | Poor 4.6% |
| Immigrants | Peru | 19.1 /100 | #202 | Poor 4.6% |
| Liberians | 18.7 /100 | #203 | Poor 4.6% |
| Immigrants | Morocco | 16.8 /100 | #204 | Poor 4.6% |
| Immigrants | Greece | 16.2 /100 | #205 | Poor 4.6% |
| Immigrants | Switzerland | 14.0 /100 | #206 | Poor 4.6% |
| Arabs | 13.7 /100 | #207 | Poor 4.6% |
| Immigrants | Africa | 13.6 /100 | #208 | Poor 4.6% |
| Immigrants | Nigeria | 13.3 /100 | #209 | Poor 4.6% |
| Immigrants | South America | 12.2 /100 | #210 | Poor 4.6% |
| Creek | 11.9 /100 | #211 | Poor 4.6% |
| Immigrants | Iran | 11.5 /100 | #212 | Poor 4.6% |
| Panamanians | 10.7 /100 | #213 | Poor 4.6% |
| Cherokee | 10.6 /100 | #214 | Poor 4.6% |