Panamanian vs Comanche Unemployment Among Ages 45 to 54 years
COMPARE
Panamanian
Comanche
Unemployment Among Ages 45 to 54 years
Unemployment Among Ages 45 to 54 years Comparison
Panamanians
Comanche
4.6%
UNEMPLOYMENT AMONG AGES 45 TO 54 YEARS
10.7/ 100
METRIC RATING
213th/ 347
METRIC RANK
4.7%
UNEMPLOYMENT AMONG AGES 45 TO 54 YEARS
4.8/ 100
METRIC RATING
224th/ 347
METRIC RANK
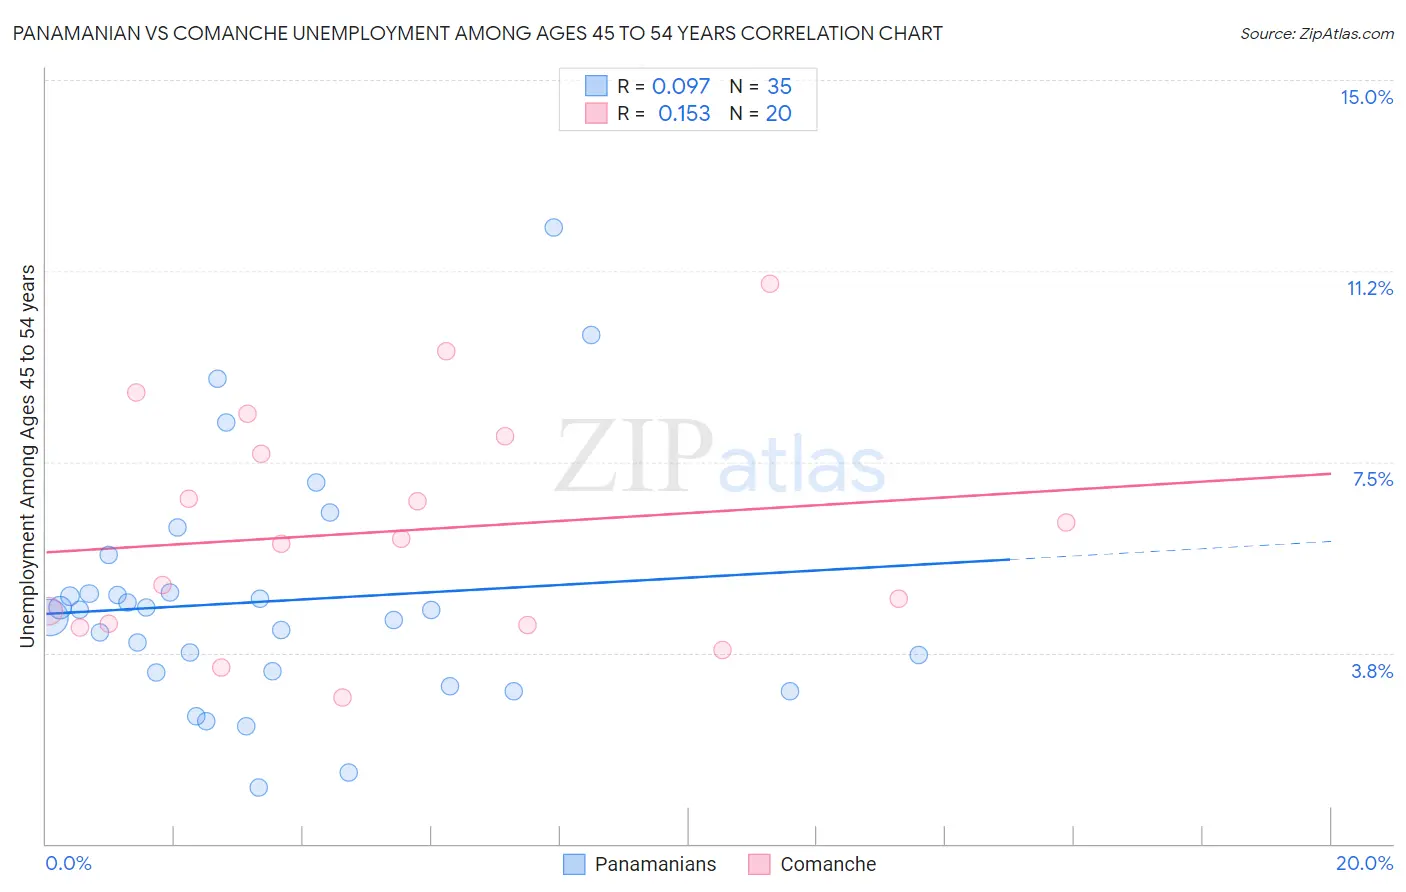
Panamanian vs Comanche Unemployment Among Ages 45 to 54 years Correlation Chart
The statistical analysis conducted on geographies consisting of 277,014,987 people shows a slight positive correlation between the proportion of Panamanians and unemployment rate among population between the ages 45 and 54 in the United States with a correlation coefficient (R) of 0.097 and weighted average of 4.6%. Similarly, the statistical analysis conducted on geographies consisting of 108,386,793 people shows a poor positive correlation between the proportion of Comanche and unemployment rate among population between the ages 45 and 54 in the United States with a correlation coefficient (R) of 0.153 and weighted average of 4.7%, a difference of 0.99%.
Unemployment Among Ages 45 to 54 years Correlation Summary
| Measurement | Panamanian | Comanche |
| Minimum | 1.1% | 2.9% |
| Maximum | 12.1% | 11.0% |
| Range | 11.0% | 8.1% |
| Mean | 4.8% | 6.1% |
| Median | 4.6% | 5.9% |
| Interquartile 25% (IQ1) | 3.4% | 4.3% |
| Interquartile 75% (IQ3) | 4.9% | 7.8% |
| Interquartile Range (IQR) | 1.6% | 3.5% |
| Standard Deviation (Sample) | 2.3% | 2.2% |
| Standard Deviation (Population) | 2.3% | 2.2% |
Demographics Similar to Panamanians and Comanche by Unemployment Among Ages 45 to 54 years
In terms of unemployment among ages 45 to 54 years, the demographic groups most similar to Panamanians are Cherokee (4.6%, a difference of 0.020%), Immigrants from Panama (4.6%, a difference of 0.040%), Immigrants from Iran (4.6%, a difference of 0.090%), Creek (4.6%, a difference of 0.13%), and Immigrants from South America (4.6%, a difference of 0.17%). Similarly, the demographic groups most similar to Comanche are Immigrants from Norway (4.7%, a difference of 0.0%), Potawatomi (4.7%, a difference of 0.20%), Immigrants from Southern Europe (4.7%, a difference of 0.26%), Choctaw (4.7%, a difference of 0.29%), and Assyrian/Chaldean/Syriac (4.7%, a difference of 0.37%).
| Demographics | Rating | Rank | Unemployment Among Ages 45 to 54 years |
| Immigrants | Africa | 13.6 /100 | #208 | Poor 4.6% |
| Immigrants | Nigeria | 13.3 /100 | #209 | Poor 4.6% |
| Immigrants | South America | 12.2 /100 | #210 | Poor 4.6% |
| Creek | 11.9 /100 | #211 | Poor 4.6% |
| Immigrants | Iran | 11.5 /100 | #212 | Poor 4.6% |
| Panamanians | 10.7 /100 | #213 | Poor 4.6% |
| Cherokee | 10.6 /100 | #214 | Poor 4.6% |
| Immigrants | Panama | 10.4 /100 | #215 | Poor 4.6% |
| Lumbee | 9.2 /100 | #216 | Tragic 4.6% |
| Immigrants | Cambodia | 7.4 /100 | #217 | Tragic 4.7% |
| Immigrants | Uganda | 7.1 /100 | #218 | Tragic 4.7% |
| Nigerians | 7.0 /100 | #219 | Tragic 4.7% |
| Guamanians/Chamorros | 6.8 /100 | #220 | Tragic 4.7% |
| Choctaw | 6.1 /100 | #221 | Tragic 4.7% |
| Immigrants | Southern Europe | 6.0 /100 | #222 | Tragic 4.7% |
| Potawatomi | 5.7 /100 | #223 | Tragic 4.7% |
| Comanche | 4.8 /100 | #224 | Tragic 4.7% |
| Immigrants | Norway | 4.8 /100 | #225 | Tragic 4.7% |
| Assyrians/Chaldeans/Syriacs | 3.5 /100 | #226 | Tragic 4.7% |
| Iraqis | 3.2 /100 | #227 | Tragic 4.7% |
| South American Indians | 3.1 /100 | #228 | Tragic 4.7% |