Paiute vs Immigrants Unemployment
COMPARE
Paiute
Immigrants
Unemployment
Unemployment Comparison
Paiute
Immigrants
7.1%
UNEMPLOYMENT
0.0/ 100
METRIC RATING
326th/ 347
METRIC RANK
5.5%
UNEMPLOYMENT
2.6/ 100
METRIC RATING
239th/ 347
METRIC RANK
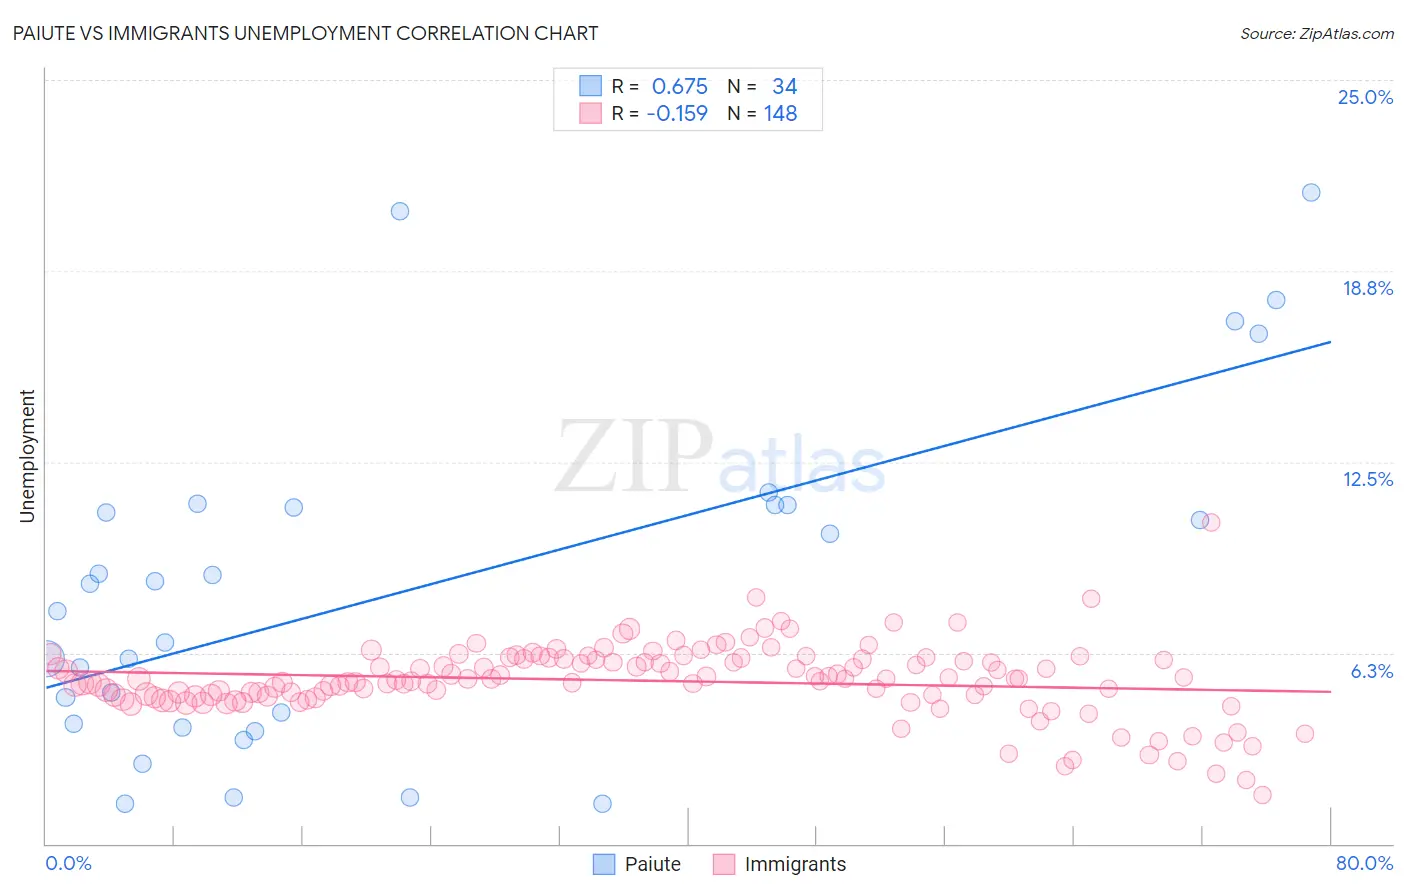
Paiute vs Immigrants Unemployment Correlation Chart
The statistical analysis conducted on geographies consisting of 58,375,117 people shows a significant positive correlation between the proportion of Paiute and unemployment in the United States with a correlation coefficient (R) of 0.675 and weighted average of 7.1%. Similarly, the statistical analysis conducted on geographies consisting of 573,511,766 people shows a poor negative correlation between the proportion of Immigrants and unemployment in the United States with a correlation coefficient (R) of -0.159 and weighted average of 5.5%, a difference of 28.2%.
Unemployment Correlation Summary
| Measurement | Paiute | Immigrants |
| Minimum | 1.3% | 1.6% |
| Maximum | 21.3% | 10.5% |
| Range | 20.0% | 8.9% |
| Mean | 8.4% | 5.3% |
| Median | 8.1% | 5.4% |
| Interquartile 25% (IQ1) | 3.9% | 4.8% |
| Interquartile 75% (IQ3) | 11.1% | 6.0% |
| Interquartile Range (IQR) | 7.2% | 1.2% |
| Standard Deviation (Sample) | 5.5% | 1.2% |
| Standard Deviation (Population) | 5.4% | 1.2% |
Similar Demographics by Unemployment
Demographics Similar to Paiute by Unemployment
In terms of unemployment, the demographic groups most similar to Paiute are Pueblo (7.2%, a difference of 0.53%), Native/Alaskan (7.0%, a difference of 1.1%), Tsimshian (7.2%, a difference of 1.4%), Immigrants from Armenia (7.0%, a difference of 1.7%), and Alaska Native (7.2%, a difference of 1.8%).
| Demographics | Rating | Rank | Unemployment |
| British West Indians | 0.0 /100 | #319 | Tragic 6.8% |
| Immigrants | St. Vincent and the Grenadines | 0.0 /100 | #320 | Tragic 6.9% |
| Immigrants | Guyana | 0.0 /100 | #321 | Tragic 6.9% |
| Guyanese | 0.0 /100 | #322 | Tragic 6.9% |
| Immigrants | Grenada | 0.0 /100 | #323 | Tragic 6.9% |
| Immigrants | Armenia | 0.0 /100 | #324 | Tragic 7.0% |
| Natives/Alaskans | 0.0 /100 | #325 | Tragic 7.0% |
| Paiute | 0.0 /100 | #326 | Tragic 7.1% |
| Pueblo | 0.0 /100 | #327 | Tragic 7.2% |
| Tsimshian | 0.0 /100 | #328 | Tragic 7.2% |
| Alaska Natives | 0.0 /100 | #329 | Tragic 7.2% |
| Yakama | 0.0 /100 | #330 | Tragic 7.3% |
| Dominicans | 0.0 /100 | #331 | Tragic 7.4% |
| Sioux | 0.0 /100 | #332 | Tragic 7.4% |
| Immigrants | Dominican Republic | 0.0 /100 | #333 | Tragic 7.4% |
Demographics Similar to Immigrants by Unemployment
In terms of unemployment, the demographic groups most similar to Immigrants are Cree (5.6%, a difference of 0.010%), Immigrants from Western Asia (5.5%, a difference of 0.090%), Moroccan (5.5%, a difference of 0.29%), Tlingit-Haida (5.6%, a difference of 0.35%), and Immigrants from Cambodia (5.5%, a difference of 0.36%).
| Demographics | Rating | Rank | Unemployment |
| Comanche | 4.9 /100 | #232 | Tragic 5.5% |
| Immigrants | Syria | 4.8 /100 | #233 | Tragic 5.5% |
| Panamanians | 4.7 /100 | #234 | Tragic 5.5% |
| Immigrants | Panama | 3.4 /100 | #235 | Tragic 5.5% |
| Immigrants | Cambodia | 3.3 /100 | #236 | Tragic 5.5% |
| Moroccans | 3.2 /100 | #237 | Tragic 5.5% |
| Immigrants | Western Asia | 2.8 /100 | #238 | Tragic 5.5% |
| Immigrants | Immigrants | 2.6 /100 | #239 | Tragic 5.5% |
| Cree | 2.6 /100 | #240 | Tragic 5.6% |
| Tlingit-Haida | 2.0 /100 | #241 | Tragic 5.6% |
| Spanish Americans | 2.0 /100 | #242 | Tragic 5.6% |
| Marshallese | 1.3 /100 | #243 | Tragic 5.6% |
| Dutch West Indians | 1.2 /100 | #244 | Tragic 5.6% |
| French American Indians | 1.2 /100 | #245 | Tragic 5.6% |
| Bermudans | 1.1 /100 | #246 | Tragic 5.6% |