Paiute vs Alaskan Athabascan Unemployment
COMPARE
Paiute
Alaskan Athabascan
Unemployment
Unemployment Comparison
Paiute
Alaskan Athabascans
7.1%
UNEMPLOYMENT
0.0/ 100
METRIC RATING
326th/ 347
METRIC RANK
7.7%
UNEMPLOYMENT
0.0/ 100
METRIC RATING
335th/ 347
METRIC RANK
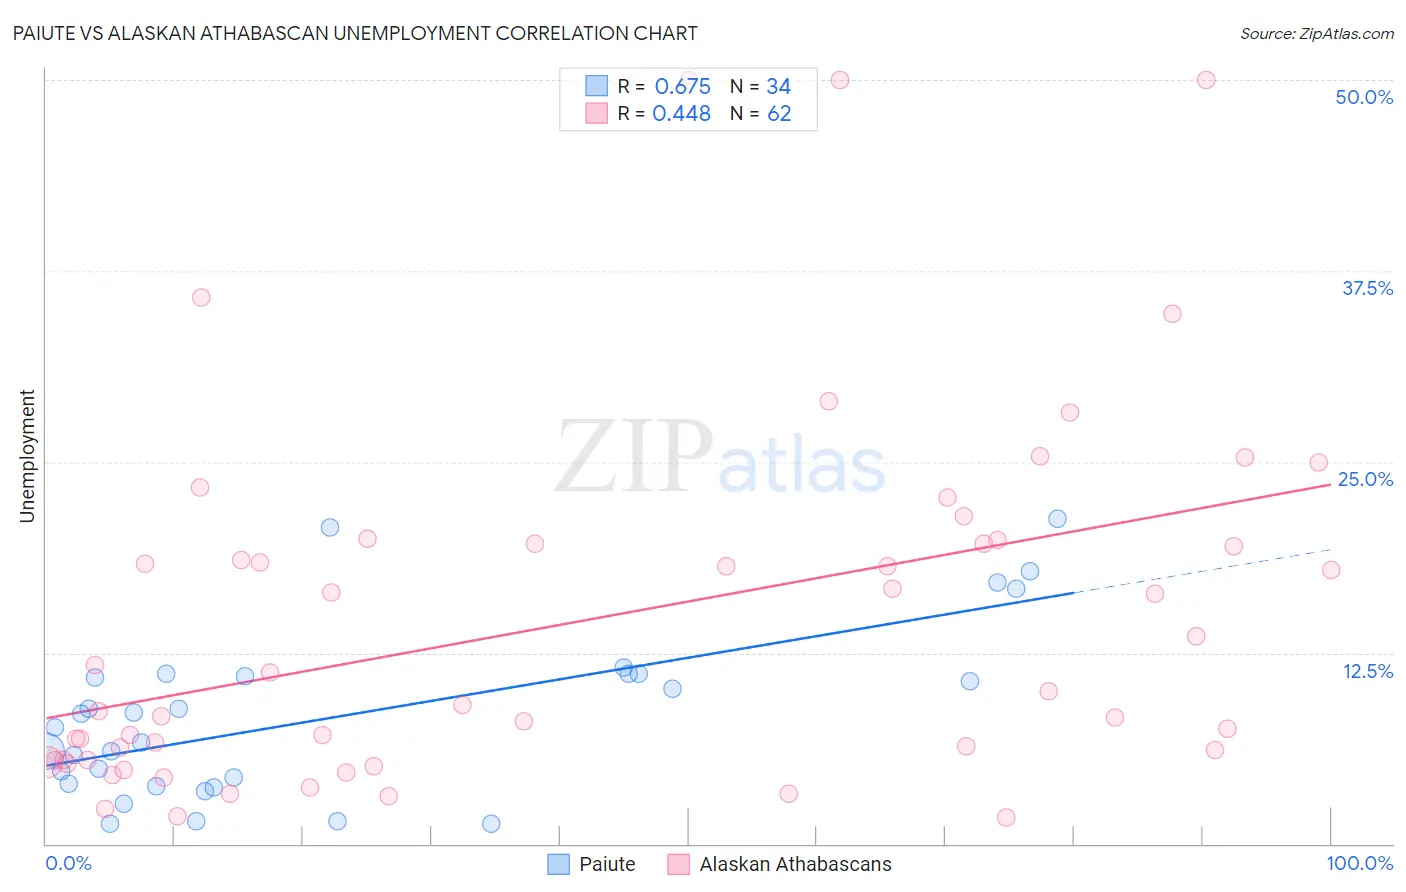
Paiute vs Alaskan Athabascan Unemployment Correlation Chart
The statistical analysis conducted on geographies consisting of 58,375,117 people shows a significant positive correlation between the proportion of Paiute and unemployment in the United States with a correlation coefficient (R) of 0.675 and weighted average of 7.1%. Similarly, the statistical analysis conducted on geographies consisting of 45,810,062 people shows a moderate positive correlation between the proportion of Alaskan Athabascans and unemployment in the United States with a correlation coefficient (R) of 0.448 and weighted average of 7.7%, a difference of 7.5%.
Unemployment Correlation Summary
| Measurement | Paiute | Alaskan Athabascan |
| Minimum | 1.3% | 1.7% |
| Maximum | 21.3% | 50.0% |
| Range | 20.0% | 48.3% |
| Mean | 8.4% | 14.5% |
| Median | 8.1% | 9.6% |
| Interquartile 25% (IQ1) | 3.9% | 5.5% |
| Interquartile 75% (IQ3) | 11.1% | 19.6% |
| Interquartile Range (IQR) | 7.2% | 14.1% |
| Standard Deviation (Sample) | 5.5% | 11.8% |
| Standard Deviation (Population) | 5.4% | 11.7% |
Demographics Similar to Paiute and Alaskan Athabascans by Unemployment
In terms of unemployment, the demographic groups most similar to Paiute are Pueblo (7.2%, a difference of 0.53%), Native/Alaskan (7.0%, a difference of 1.1%), Tsimshian (7.2%, a difference of 1.4%), Immigrants from Armenia (7.0%, a difference of 1.7%), and Alaska Native (7.2%, a difference of 1.8%). Similarly, the demographic groups most similar to Alaskan Athabascans are Immigrants from Yemen (7.7%, a difference of 0.72%), Apache (7.4%, a difference of 3.0%), Immigrants from Dominican Republic (7.4%, a difference of 3.5%), Sioux (7.4%, a difference of 3.6%), and Dominican (7.4%, a difference of 4.0%).
| Demographics | Rating | Rank | Unemployment |
| Immigrants | St. Vincent and the Grenadines | 0.0 /100 | #320 | Tragic 6.9% |
| Immigrants | Guyana | 0.0 /100 | #321 | Tragic 6.9% |
| Guyanese | 0.0 /100 | #322 | Tragic 6.9% |
| Immigrants | Grenada | 0.0 /100 | #323 | Tragic 6.9% |
| Immigrants | Armenia | 0.0 /100 | #324 | Tragic 7.0% |
| Natives/Alaskans | 0.0 /100 | #325 | Tragic 7.0% |
| Paiute | 0.0 /100 | #326 | Tragic 7.1% |
| Pueblo | 0.0 /100 | #327 | Tragic 7.2% |
| Tsimshian | 0.0 /100 | #328 | Tragic 7.2% |
| Alaska Natives | 0.0 /100 | #329 | Tragic 7.2% |
| Yakama | 0.0 /100 | #330 | Tragic 7.3% |
| Dominicans | 0.0 /100 | #331 | Tragic 7.4% |
| Sioux | 0.0 /100 | #332 | Tragic 7.4% |
| Immigrants | Dominican Republic | 0.0 /100 | #333 | Tragic 7.4% |
| Apache | 0.0 /100 | #334 | Tragic 7.4% |
| Alaskan Athabascans | 0.0 /100 | #335 | Tragic 7.7% |
| Immigrants | Yemen | 0.0 /100 | #336 | Tragic 7.7% |
| Cheyenne | 0.0 /100 | #337 | Tragic 8.0% |
| Pima | 0.0 /100 | #338 | Tragic 8.2% |
| Navajo | 0.0 /100 | #339 | Tragic 8.4% |
| Puerto Ricans | 0.0 /100 | #340 | Tragic 8.4% |