Osage vs Immigrants from Venezuela Unemployment Among Youth under 25 years
COMPARE
Osage
Immigrants from Venezuela
Unemployment Among Youth under 25 years
Unemployment Among Youth under 25 years Comparison
Osage
Immigrants from Venezuela
10.7%
UNEMPLOYMENT AMONG YOUTH UNDER 25 YEARS
99.9/ 100
METRIC RATING
30th/ 347
METRIC RANK
10.5%
UNEMPLOYMENT AMONG YOUTH UNDER 25 YEARS
100.0/ 100
METRIC RATING
8th/ 347
METRIC RANK
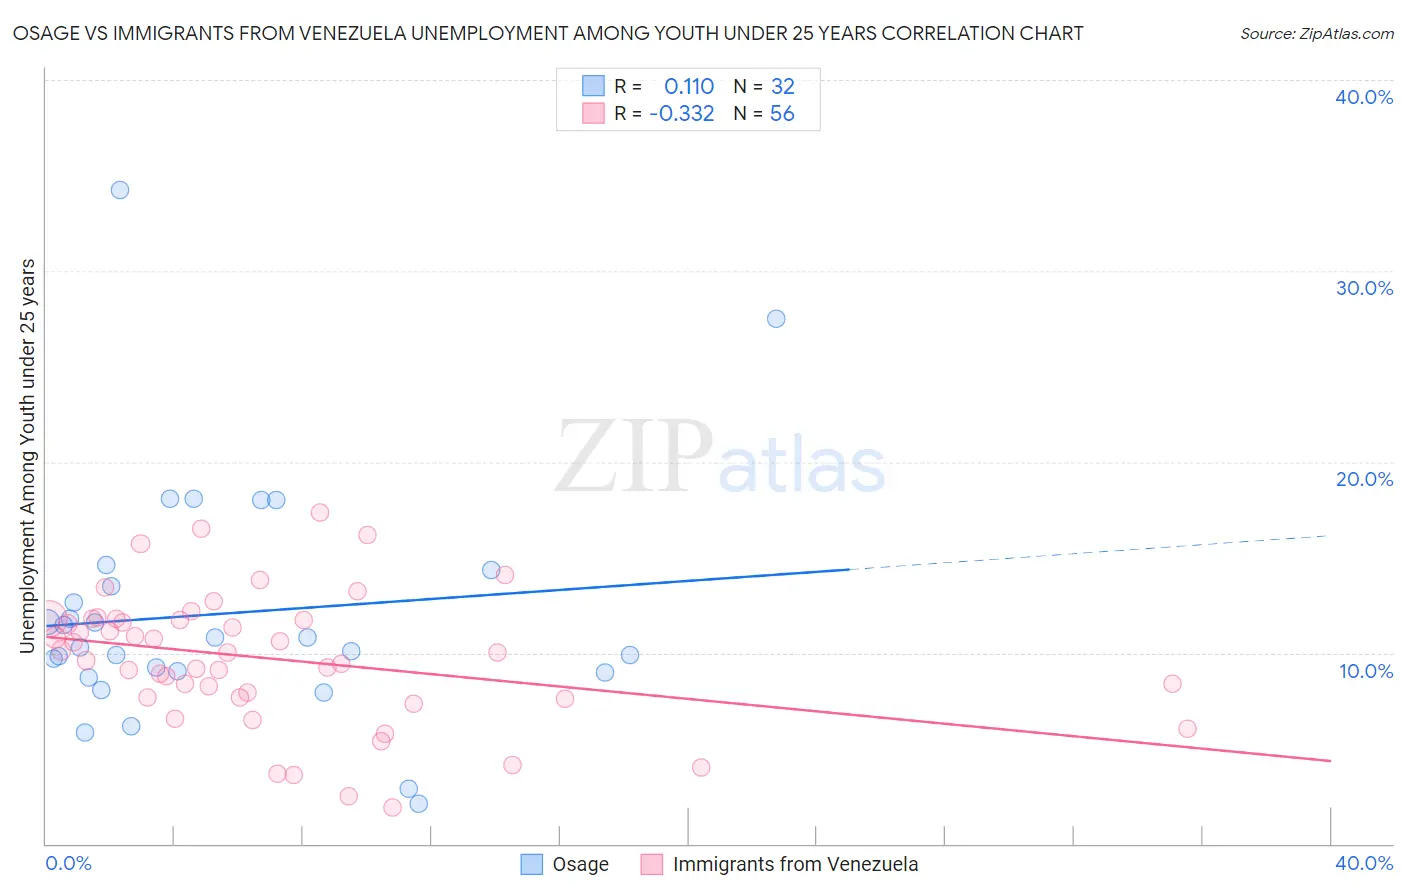
Osage vs Immigrants from Venezuela Unemployment Among Youth under 25 years Correlation Chart
The statistical analysis conducted on geographies consisting of 91,372,569 people shows a poor positive correlation between the proportion of Osage and unemployment rate among youth under the age of 25 in the United States with a correlation coefficient (R) of 0.110 and weighted average of 10.7%. Similarly, the statistical analysis conducted on geographies consisting of 286,034,165 people shows a mild negative correlation between the proportion of Immigrants from Venezuela and unemployment rate among youth under the age of 25 in the United States with a correlation coefficient (R) of -0.332 and weighted average of 10.5%, a difference of 2.3%.
Unemployment Among Youth under 25 years Correlation Summary
| Measurement | Osage | Immigrants from Venezuela |
| Minimum | 2.1% | 1.9% |
| Maximum | 34.2% | 17.4% |
| Range | 32.1% | 15.5% |
| Mean | 12.1% | 9.7% |
| Median | 10.5% | 10.0% |
| Interquartile 25% (IQ1) | 9.0% | 7.7% |
| Interquartile 75% (IQ3) | 13.9% | 11.7% |
| Interquartile Range (IQR) | 4.9% | 4.1% |
| Standard Deviation (Sample) | 6.3% | 3.4% |
| Standard Deviation (Population) | 6.2% | 3.4% |
Similar Demographics by Unemployment Among Youth under 25 years
Demographics Similar to Osage by Unemployment Among Youth under 25 years
In terms of unemployment among youth under 25 years, the demographic groups most similar to Osage are Chinese (10.7%, a difference of 0.060%), Slovene (10.7%, a difference of 0.11%), Taiwanese (10.8%, a difference of 0.37%), Somali (10.7%, a difference of 0.41%), and Yugoslavian (10.7%, a difference of 0.45%).
| Demographics | Rating | Rank | Unemployment Among Youth under 25 years |
| Immigrants | Bosnia and Herzegovina | 100.0 /100 | #23 | Exceptional 10.6% |
| Finns | 100.0 /100 | #24 | Exceptional 10.7% |
| Immigrants | North Macedonia | 100.0 /100 | #25 | Exceptional 10.7% |
| Immigrants | India | 100.0 /100 | #26 | Exceptional 10.7% |
| Yugoslavians | 100.0 /100 | #27 | Exceptional 10.7% |
| Somalis | 100.0 /100 | #28 | Exceptional 10.7% |
| Chinese | 99.9 /100 | #29 | Exceptional 10.7% |
| Osage | 99.9 /100 | #30 | Exceptional 10.7% |
| Slovenes | 99.9 /100 | #31 | Exceptional 10.7% |
| Taiwanese | 99.9 /100 | #32 | Exceptional 10.8% |
| Europeans | 99.9 /100 | #33 | Exceptional 10.8% |
| English | 99.9 /100 | #34 | Exceptional 10.8% |
| Immigrants | Nepal | 99.9 /100 | #35 | Exceptional 10.8% |
| Hmong | 99.8 /100 | #36 | Exceptional 10.8% |
| Immigrants | Zimbabwe | 99.8 /100 | #37 | Exceptional 10.8% |
Demographics Similar to Immigrants from Venezuela by Unemployment Among Youth under 25 years
In terms of unemployment among youth under 25 years, the demographic groups most similar to Immigrants from Venezuela are German (10.5%, a difference of 0.40%), Immigrants from Somalia (10.5%, a difference of 0.42%), Scandinavian (10.5%, a difference of 0.55%), Immigrants from Sudan (10.5%, a difference of 0.73%), and Swedish (10.4%, a difference of 0.78%).
| Demographics | Rating | Rank | Unemployment Among Youth under 25 years |
| Norwegians | 100.0 /100 | #1 | Exceptional 9.8% |
| Immigrants | Cuba | 100.0 /100 | #2 | Exceptional 10.0% |
| Luxembourgers | 100.0 /100 | #3 | Exceptional 10.0% |
| Zimbabweans | 100.0 /100 | #4 | Exceptional 10.2% |
| Czechs | 100.0 /100 | #5 | Exceptional 10.3% |
| Danes | 100.0 /100 | #6 | Exceptional 10.3% |
| Swedes | 100.0 /100 | #7 | Exceptional 10.4% |
| Immigrants | Venezuela | 100.0 /100 | #8 | Exceptional 10.5% |
| Germans | 100.0 /100 | #9 | Exceptional 10.5% |
| Immigrants | Somalia | 100.0 /100 | #10 | Exceptional 10.5% |
| Scandinavians | 100.0 /100 | #11 | Exceptional 10.5% |
| Immigrants | Sudan | 100.0 /100 | #12 | Exceptional 10.5% |
| Indonesians | 100.0 /100 | #13 | Exceptional 10.6% |
| Cubans | 100.0 /100 | #14 | Exceptional 10.6% |
| Sudanese | 100.0 /100 | #15 | Exceptional 10.6% |