Maltese vs Immigrants from Venezuela Unemployment Among Youth under 25 years
COMPARE
Maltese
Immigrants from Venezuela
Unemployment Among Youth under 25 years
Unemployment Among Youth under 25 years Comparison
Maltese
Immigrants from Venezuela
11.7%
UNEMPLOYMENT AMONG YOUTH UNDER 25 YEARS
33.9/ 100
METRIC RATING
186th/ 347
METRIC RANK
10.5%
UNEMPLOYMENT AMONG YOUTH UNDER 25 YEARS
100.0/ 100
METRIC RATING
8th/ 347
METRIC RANK
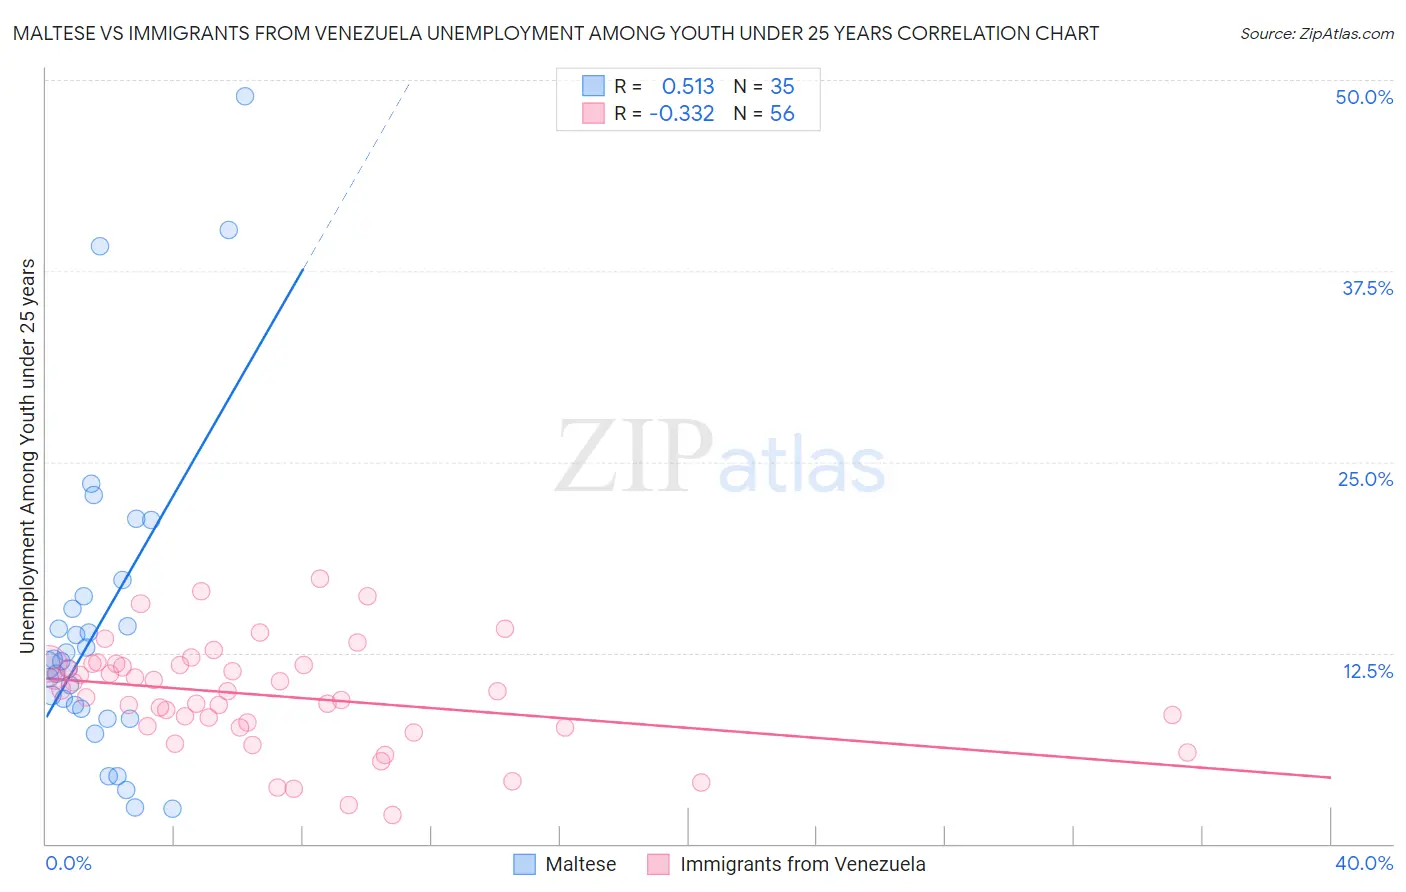
Maltese vs Immigrants from Venezuela Unemployment Among Youth under 25 years Correlation Chart
The statistical analysis conducted on geographies consisting of 125,852,154 people shows a substantial positive correlation between the proportion of Maltese and unemployment rate among youth under the age of 25 in the United States with a correlation coefficient (R) of 0.513 and weighted average of 11.7%. Similarly, the statistical analysis conducted on geographies consisting of 286,034,165 people shows a mild negative correlation between the proportion of Immigrants from Venezuela and unemployment rate among youth under the age of 25 in the United States with a correlation coefficient (R) of -0.332 and weighted average of 10.5%, a difference of 11.6%.
Unemployment Among Youth under 25 years Correlation Summary
| Measurement | Maltese | Immigrants from Venezuela |
| Minimum | 2.3% | 1.9% |
| Maximum | 48.9% | 17.4% |
| Range | 46.6% | 15.5% |
| Mean | 14.4% | 9.7% |
| Median | 12.0% | 10.0% |
| Interquartile 25% (IQ1) | 8.8% | 7.7% |
| Interquartile 75% (IQ3) | 16.2% | 11.7% |
| Interquartile Range (IQR) | 7.4% | 4.1% |
| Standard Deviation (Sample) | 10.4% | 3.4% |
| Standard Deviation (Population) | 10.2% | 3.4% |
Similar Demographics by Unemployment Among Youth under 25 years
Demographics Similar to Maltese by Unemployment Among Youth under 25 years
In terms of unemployment among youth under 25 years, the demographic groups most similar to Maltese are French American Indian (11.7%, a difference of 0.0%), Immigrants from Eastern Europe (11.7%, a difference of 0.010%), American (11.7%, a difference of 0.030%), Immigrants from Egypt (11.7%, a difference of 0.090%), and Immigrants from Italy (11.7%, a difference of 0.10%).
| Demographics | Rating | Rank | Unemployment Among Youth under 25 years |
| Immigrants | Hong Kong | 42.4 /100 | #179 | Average 11.6% |
| Spaniards | 39.8 /100 | #180 | Fair 11.7% |
| Syrians | 38.4 /100 | #181 | Fair 11.7% |
| Immigrants | Italy | 36.2 /100 | #182 | Fair 11.7% |
| Americans | 34.5 /100 | #183 | Fair 11.7% |
| Immigrants | Eastern Europe | 34.1 /100 | #184 | Fair 11.7% |
| French American Indians | 34.0 /100 | #185 | Fair 11.7% |
| Maltese | 33.9 /100 | #186 | Fair 11.7% |
| Immigrants | Egypt | 31.9 /100 | #187 | Fair 11.7% |
| Immigrants | Poland | 31.4 /100 | #188 | Fair 11.7% |
| Japanese | 30.8 /100 | #189 | Fair 11.7% |
| Portuguese | 30.3 /100 | #190 | Fair 11.7% |
| Cypriots | 28.5 /100 | #191 | Fair 11.7% |
| Immigrants | Russia | 28.5 /100 | #192 | Fair 11.7% |
| Seminole | 27.9 /100 | #193 | Fair 11.7% |
Demographics Similar to Immigrants from Venezuela by Unemployment Among Youth under 25 years
In terms of unemployment among youth under 25 years, the demographic groups most similar to Immigrants from Venezuela are German (10.5%, a difference of 0.40%), Immigrants from Somalia (10.5%, a difference of 0.42%), Scandinavian (10.5%, a difference of 0.55%), Immigrants from Sudan (10.5%, a difference of 0.73%), and Swedish (10.4%, a difference of 0.78%).
| Demographics | Rating | Rank | Unemployment Among Youth under 25 years |
| Norwegians | 100.0 /100 | #1 | Exceptional 9.8% |
| Immigrants | Cuba | 100.0 /100 | #2 | Exceptional 10.0% |
| Luxembourgers | 100.0 /100 | #3 | Exceptional 10.0% |
| Zimbabweans | 100.0 /100 | #4 | Exceptional 10.2% |
| Czechs | 100.0 /100 | #5 | Exceptional 10.3% |
| Danes | 100.0 /100 | #6 | Exceptional 10.3% |
| Swedes | 100.0 /100 | #7 | Exceptional 10.4% |
| Immigrants | Venezuela | 100.0 /100 | #8 | Exceptional 10.5% |
| Germans | 100.0 /100 | #9 | Exceptional 10.5% |
| Immigrants | Somalia | 100.0 /100 | #10 | Exceptional 10.5% |
| Scandinavians | 100.0 /100 | #11 | Exceptional 10.5% |
| Immigrants | Sudan | 100.0 /100 | #12 | Exceptional 10.5% |
| Indonesians | 100.0 /100 | #13 | Exceptional 10.6% |
| Cubans | 100.0 /100 | #14 | Exceptional 10.6% |
| Sudanese | 100.0 /100 | #15 | Exceptional 10.6% |