Norwegian vs Immigrants from St. Vincent and the Grenadines Unemployment Among Ages 60 to 64 years
COMPARE
Norwegian
Immigrants from St. Vincent and the Grenadines
Unemployment Among Ages 60 to 64 years
Unemployment Among Ages 60 to 64 years Comparison
Norwegians
Immigrants from St. Vincent and the Grenadines
4.3%
UNEMPLOYMENT AMONG AGES 60 TO 64 YEARS
100.0/ 100
METRIC RATING
14th/ 347
METRIC RANK
5.9%
UNEMPLOYMENT AMONG AGES 60 TO 64 YEARS
0.0/ 100
METRIC RATING
326th/ 347
METRIC RANK
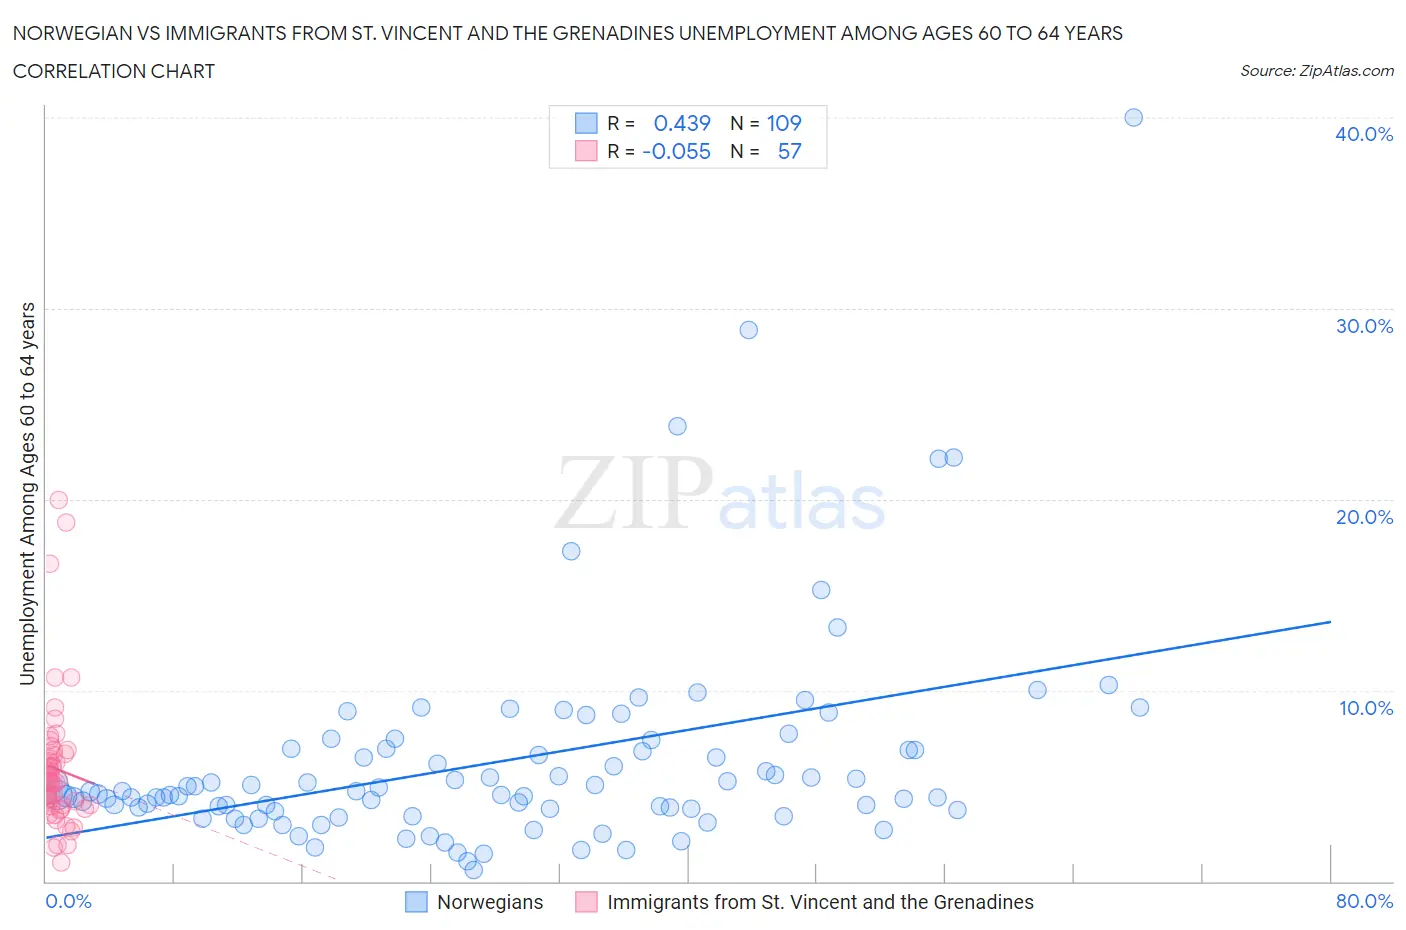
Norwegian vs Immigrants from St. Vincent and the Grenadines Unemployment Among Ages 60 to 64 years Correlation Chart
The statistical analysis conducted on geographies consisting of 445,566,170 people shows a moderate positive correlation between the proportion of Norwegians and unemployment rate among population between the ages 60 and 64 in the United States with a correlation coefficient (R) of 0.439 and weighted average of 4.3%. Similarly, the statistical analysis conducted on geographies consisting of 54,910,392 people shows a slight negative correlation between the proportion of Immigrants from St. Vincent and the Grenadines and unemployment rate among population between the ages 60 and 64 in the United States with a correlation coefficient (R) of -0.055 and weighted average of 5.9%, a difference of 35.6%.
Unemployment Among Ages 60 to 64 years Correlation Summary
| Measurement | Norwegian | Immigrants from St. Vincent and the Grenadines |
| Minimum | 0.59% | 1.0% |
| Maximum | 40.0% | 20.0% |
| Range | 39.4% | 19.0% |
| Mean | 6.3% | 5.9% |
| Median | 4.6% | 5.2% |
| Interquartile 25% (IQ1) | 3.7% | 4.0% |
| Interquartile 75% (IQ3) | 6.9% | 6.7% |
| Interquartile Range (IQR) | 3.2% | 2.7% |
| Standard Deviation (Sample) | 5.6% | 3.6% |
| Standard Deviation (Population) | 5.6% | 3.6% |
Similar Demographics by Unemployment Among Ages 60 to 64 years
Demographics Similar to Norwegians by Unemployment Among Ages 60 to 64 years
In terms of unemployment among ages 60 to 64 years, the demographic groups most similar to Norwegians are Chickasaw (4.3%, a difference of 0.050%), Immigrants from Cuba (4.3%, a difference of 0.10%), Sudanese (4.3%, a difference of 0.50%), Danish (4.4%, a difference of 0.75%), and Immigrants from Afghanistan (4.4%, a difference of 0.91%).
| Demographics | Rating | Rank | Unemployment Among Ages 60 to 64 years |
| Lumbee | 100.0 /100 | #7 | Exceptional 4.2% |
| Immigrants | Micronesia | 100.0 /100 | #8 | Exceptional 4.2% |
| Indonesians | 100.0 /100 | #9 | Exceptional 4.2% |
| Immigrants | Bosnia and Herzegovina | 100.0 /100 | #10 | Exceptional 4.2% |
| Luxembourgers | 100.0 /100 | #11 | Exceptional 4.3% |
| Immigrants | Cuba | 100.0 /100 | #12 | Exceptional 4.3% |
| Chickasaw | 100.0 /100 | #13 | Exceptional 4.3% |
| Norwegians | 100.0 /100 | #14 | Exceptional 4.3% |
| Sudanese | 100.0 /100 | #15 | Exceptional 4.3% |
| Danes | 100.0 /100 | #16 | Exceptional 4.4% |
| Immigrants | Afghanistan | 100.0 /100 | #17 | Exceptional 4.4% |
| Slovenes | 100.0 /100 | #18 | Exceptional 4.4% |
| Tsimshian | 100.0 /100 | #19 | Exceptional 4.4% |
| Afghans | 100.0 /100 | #20 | Exceptional 4.4% |
| Immigrants | Cabo Verde | 100.0 /100 | #21 | Exceptional 4.4% |
Demographics Similar to Immigrants from St. Vincent and the Grenadines by Unemployment Among Ages 60 to 64 years
In terms of unemployment among ages 60 to 64 years, the demographic groups most similar to Immigrants from St. Vincent and the Grenadines are Immigrants from Grenada (5.9%, a difference of 0.060%), Paiute (5.8%, a difference of 0.94%), Immigrants from Ecuador (5.8%, a difference of 0.95%), Alsatian (5.8%, a difference of 1.3%), and Apache (6.0%, a difference of 1.4%).
| Demographics | Rating | Rank | Unemployment Among Ages 60 to 64 years |
| Immigrants | Belize | 0.0 /100 | #319 | Tragic 5.7% |
| Colville | 0.0 /100 | #320 | Tragic 5.7% |
| Dutch West Indians | 0.0 /100 | #321 | Tragic 5.7% |
| Ecuadorians | 0.0 /100 | #322 | Tragic 5.8% |
| Alsatians | 0.0 /100 | #323 | Tragic 5.8% |
| Immigrants | Ecuador | 0.0 /100 | #324 | Tragic 5.8% |
| Paiute | 0.0 /100 | #325 | Tragic 5.8% |
| Immigrants | St. Vincent and the Grenadines | 0.0 /100 | #326 | Tragic 5.9% |
| Immigrants | Grenada | 0.0 /100 | #327 | Tragic 5.9% |
| Apache | 0.0 /100 | #328 | Tragic 6.0% |
| Immigrants | Bangladesh | 0.0 /100 | #329 | Tragic 6.0% |
| Immigrants | Armenia | 0.0 /100 | #330 | Tragic 6.0% |
| Yakama | 0.0 /100 | #331 | Tragic 6.0% |
| Dominicans | 0.0 /100 | #332 | Tragic 6.0% |
| Immigrants | Dominican Republic | 0.0 /100 | #333 | Tragic 6.0% |