Cuban vs Immigrants from St. Vincent and the Grenadines Unemployment Among Ages 60 to 64 years

COMPARE

Cuban
Race
Ancestry
AfghanAfricanAlaska NativeAlaskan AthabascanAlbanianAleutAlsatianAmericanApacheArabArapahoArgentineanArmenianAssyrian/Chaldean/SyriacAustralianAustrianBahamianBangladeshiBarbadianBasqueBelgianBelizeanBermudanBhutaneseBlackfeetBolivianBrazilianBritishBritish West IndianBulgarianBurmeseCajunCambodianCanadianCape VerdeanCarpatho RusynCelticCentral AmericanCentral American IndianCherokeeCheyenneChickasawChileanChineseChippewaChoctawColombianColvilleComancheCosta RicanCreeCreekCroatianCrowCubanCypriotCzechCzechoslovakianDanishDelawareDominicanDutchDutch West IndianEastern EuropeanEcuadorianEgyptianEnglishEstonianEthiopianEuropeanFijianFilipinoFinnishFrenchFrench American IndianFrench CanadianGermanGerman RussianGhanaianGreekGuamanian/ChamorroGuatemalanGuyaneseHaitianHmongHonduranHopiHoumaHungarianIcelanderIndian (Asian)IndonesianInupiatIranianIraqiIrishIroquoisIsraeliItalianJamaicanJapaneseJordanianKenyanKiowaKoreanLaotianLatvianLebaneseLiberianLithuanianLumbeeLuxembourgerMacedonianMalaysianMalteseMarshalleseMenomineeMexicanMexican American IndianMongolianMoroccanNative HawaiianNavajoNepaleseNew ZealanderNicaraguanNigerianNorthern EuropeanNorwegianOkinawanOsageOttawaPaiutePakistaniPalestinianPanamanianParaguayanPennsylvania GermanPeruvianPimaPolishPortuguesePotawatomiPuebloPuerto RicanPuget Sound SalishRomanianRussianSalvadoranSamoanScandinavianScotch-IrishScottishSeminoleSenegaleseSerbianShoshoneSierra LeoneanSiouxSlavicSlovakSloveneSomaliSouth AfricanSouth AmericanSouth American IndianSoviet UnionSpaniardSpanishSpanish AmericanSpanish American IndianSri LankanSubsaharan AfricanSudaneseSwedishSwissSyrianTaiwaneseThaiTlingit-HaidaTohono O'OdhamTonganTrinidadian and TobagonianTsimshianTurkishU.S. Virgin IslanderUgandanUkrainianUruguayanUteVenezuelanVietnameseWelshWest IndianYakamaYaquiYugoslavianYumanYup'ikZimbabwean
Immigration
NonimmigrantsImmigrantsAfghanistanAfricaAlbaniaArgentinaArmeniaAsiaAustraliaAustriaBahamasBangladeshBarbadosBelarusBelgiumBelizeBoliviaBosnia and HerzegovinaBrazilBulgariaBurma/MyanmarCabo VerdeCambodiaCameroonCanadaCaribbeanCentral AmericaChileChinaColombiaCongoCosta RicaCroatiaCubaCzechoslovakiaDenmarkDominicaDominican RepublicEastern AfricaEastern AsiaEastern EuropeEcuadorEgyptEl SalvadorEnglandEritreaEthiopiaEuropeFijiFranceGermanyGhanaGreeceGrenadaGuatemalaGuyanaHaitiHondurasHong KongHungaryIndiaIndonesiaIranIraqIrelandIsraelItalyJamaicaJapanJordanKazakhstanKenyaKoreaKuwaitLaosLatin AmericaLatviaLebanonLiberiaLithuaniaMalaysiaMexicoMicronesiaMiddle AfricaMoldovaMoroccoNepalNetherlandsNicaraguaNigeriaNorth AmericaNorth MacedoniaNorthern AfricaNorthern EuropeNorwayOceaniaPakistanPanamaPeruPhilippinesPolandPortugalRomaniaRussiaSaudi ArabiaScotlandSenegalSerbiaSierra LeoneSingaporeSomaliaSouth AfricaSouth AmericaSouth Central AsiaSouth Eastern AsiaSouthern EuropeSpainSri LankaSudanSwedenSwitzerlandSyriaTaiwanThailandTrinidad and TobagoTurkeyUgandaUkraineUruguayUzbekistanVenezuelaVietnamWest IndiesWestern AfricaWestern AsiaWestern EuropeYemenZaireZimbabweAzores
Immigrants from St. Vincent and the Grenadines
Race
Ancestry
AfghanAfricanAlaska NativeAlaskan AthabascanAlbanianAleutAlsatianAmericanApacheArabArapahoArgentineanArmenianAssyrian/Chaldean/SyriacAustralianAustrianBahamianBangladeshiBarbadianBasqueBelgianBelizeanBermudanBhutaneseBlackfeetBolivianBrazilianBritishBritish West IndianBulgarianBurmeseCajunCambodianCanadianCape VerdeanCarpatho RusynCelticCentral AmericanCentral American IndianCherokeeCheyenneChickasawChileanChineseChippewaChoctawColombianColvilleComancheCosta RicanCreeCreekCroatianCrowCypriotCzechCzechoslovakianDanishDelawareDominicanDutchDutch West IndianEastern EuropeanEcuadorianEgyptianEnglishEstonianEthiopianEuropeanFijianFilipinoFinnishFrenchFrench American IndianFrench CanadianGermanGerman RussianGhanaianGreekGuamanian/ChamorroGuatemalanGuyaneseHaitianHmongHonduranHopiHoumaHungarianIcelanderIndian (Asian)IndonesianInupiatIranianIraqiIrishIroquoisIsraeliItalianJamaicanJapaneseJordanianKenyanKiowaKoreanLaotianLatvianLebaneseLiberianLithuanianLumbeeLuxembourgerMacedonianMalaysianMalteseMarshalleseMenomineeMexicanMexican American IndianMongolianMoroccanNative HawaiianNavajoNepaleseNew ZealanderNicaraguanNigerianNorthern EuropeanNorwegianOkinawanOsageOttawaPaiutePakistaniPalestinianPanamanianParaguayanPennsylvania GermanPeruvianPimaPolishPortuguesePotawatomiPuebloPuerto RicanPuget Sound SalishRomanianRussianSalvadoranSamoanScandinavianScotch-IrishScottishSeminoleSenegaleseSerbianShoshoneSierra LeoneanSiouxSlavicSlovakSloveneSomaliSouth AfricanSouth AmericanSouth American IndianSoviet UnionSpaniardSpanishSpanish AmericanSpanish American IndianSri LankanSubsaharan AfricanSudaneseSwedishSwissSyrianTaiwaneseThaiTlingit-HaidaTohono O'OdhamTonganTrinidadian and TobagonianTsimshianTurkishU.S. Virgin IslanderUgandanUkrainianUruguayanUteVenezuelanVietnameseWelshWest IndianYakamaYaquiYugoslavianYumanYup'ikZimbabwean
Immigration
NonimmigrantsImmigrantsAfghanistanAfricaAlbaniaArgentinaArmeniaAsiaAustraliaAustriaBahamasBangladeshBarbadosBelarusBelgiumBelizeBoliviaBosnia and HerzegovinaBrazilBulgariaBurma/MyanmarCabo VerdeCambodiaCameroonCanadaCaribbeanCentral AmericaChileChinaColombiaCongoCosta RicaCroatiaCubaCzechoslovakiaDenmarkDominicaDominican RepublicEastern AfricaEastern AsiaEastern EuropeEcuadorEgyptEl SalvadorEnglandEritreaEthiopiaEuropeFijiFranceGermanyGhanaGreeceGrenadaGuatemalaGuyanaHaitiHondurasHong KongHungaryIndiaIndonesiaIranIraqIrelandIsraelItalyJamaicaJapanJordanKazakhstanKenyaKoreaKuwaitLaosLatin AmericaLatviaLebanonLiberiaLithuaniaMalaysiaMexicoMicronesiaMiddle AfricaMoldovaMoroccoNepalNetherlandsNicaraguaNigeriaNorth AmericaNorth MacedoniaNorthern AfricaNorthern EuropeNorwayOceaniaPakistanPanamaPeruPhilippinesPolandPortugalRomaniaRussiaSaudi ArabiaScotlandSenegalSerbiaSierra LeoneSingaporeSomaliaSouth AfricaSouth AmericaSouth Central AsiaSouth Eastern AsiaSouthern EuropeSpainSri LankaSt. Vincent and the GrenadinesSudanSwedenSwitzerlandSyriaTaiwanThailandTrinidad and TobagoTurkeyUgandaUkraineUruguayUzbekistanVenezuelaVietnamWest IndiesWestern AfricaWestern AsiaWestern EuropeYemenZaireZimbabweAzores
Unemployment Among Ages 60 to 64 years
Income
Poverty
Unemployment
Labor Participation
Family Structure
Vehicle Availability
Education Level
Disability

Unemployment Among Ages 60 to 64 years Comparison

Cubans

Immigrants from St. Vincent and the Grenadines

Exceptional
Tragic
4.5%
UNEMPLOYMENT AMONG AGES 60 TO 64 YEARS
100.0/ 100
METRIC RATING
29th/ 347
METRIC RANK
5.9%
UNEMPLOYMENT AMONG AGES 60 TO 64 YEARS
0.0/ 100
METRIC RATING
326th/ 347
METRIC RANK

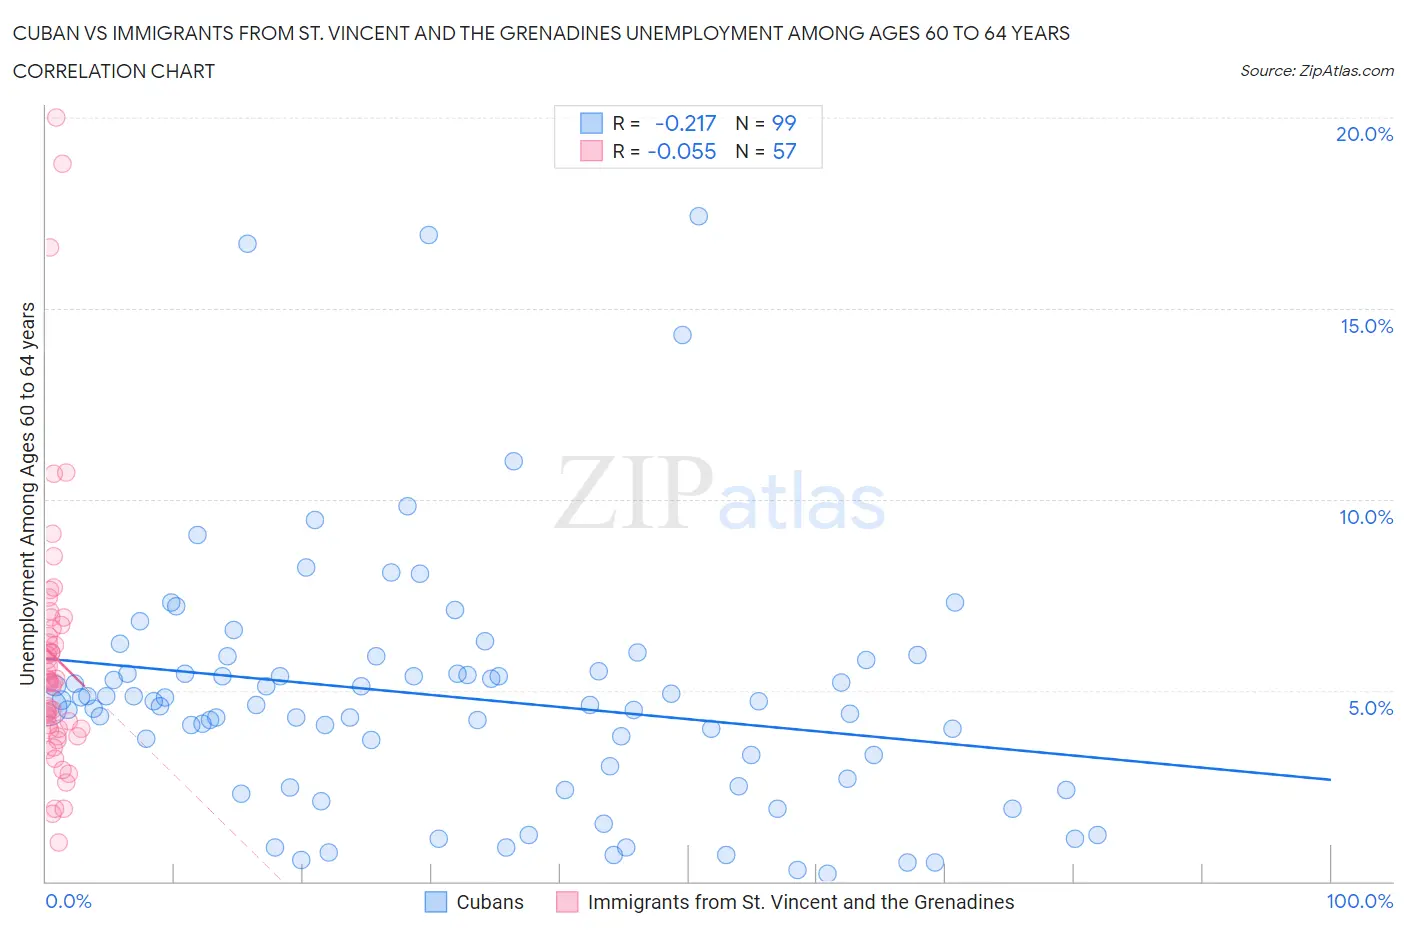
Cuban vs Immigrants from St. Vincent and the Grenadines Unemployment Among Ages 60 to 64 years Correlation Chart

The statistical analysis conducted on geographies consisting of 400,465,537 people shows a weak negative correlation between the proportion of Cubans and unemployment rate among population between the ages 60 and 64 in the United States with a correlation coefficient (R) of -0.217 and weighted average of 4.5%. Similarly, the statistical analysis conducted on geographies consisting of 54,910,392 people shows a slight negative correlation between the proportion of Immigrants from St. Vincent and the Grenadines and unemployment rate among population between the ages 60 and 64 in the United States with a correlation coefficient (R) of -0.055 and weighted average of 5.9%, a difference of 31.3%.
Cuban vs Immigrants from St. Vincent and the Grenadines Unemployment Among Ages 60 to 64 years

Unemployment Among Ages 60 to 64 years Correlation Summary

MeasurementCubanImmigrants from St. Vincent and the Grenadines
Minimum0.20%1.0%
Maximum17.4%20.0%
Range17.2%19.0%
Mean4.8%5.9%
Median4.6%5.2%
Interquartile 25% (IQ1)2.7%4.0%
Interquartile 75% (IQ3)5.5%6.7%
Interquartile Range (IQR)2.8%2.7%
Standard Deviation (Sample)3.3%3.6%
Standard Deviation (Population)3.3%3.6%

Similar Demographics by Unemployment Among Ages 60 to 64 years

Demographics Similar to Cubans by Unemployment Among Ages 60 to 64 years

In terms of unemployment among ages 60 to 64 years, the demographic groups most similar to Cubans are Immigrants from Venezuela (4.5%, a difference of 0.020%), Immigrants from Eritrea (4.5%, a difference of 0.090%), Zimbabwean (4.5%, a difference of 0.13%), Carpatho Rusyn (4.5%, a difference of 0.18%), and Immigrants from Nepal (4.5%, a difference of 0.23%).
DemographicsRating | RankUnemployment Among Ages 60 to 64 years
Cape Verdeans
100.0
/100
|
#22
Exceptional
4.4%
Immigrants | Zaire
100.0
/100
|
#23
Exceptional
4.4%
Immigrants | Burma/Myanmar
100.0
/100
|
#24
Exceptional
4.4%
Yugoslavians
100.0
/100
|
#25
Exceptional
4.4%
Czechs
100.0
/100
|
#26
Exceptional
4.4%
Immigrants | Iraq
100.0
/100
|
#27
Exceptional
4.5%
Immigrants | Nepal
100.0
/100
|
#28
Exceptional
4.5%
Cubans
100.0
/100
|
#29
Exceptional
4.5%
Immigrants | Venezuela
100.0
/100
|
#30
Exceptional
4.5%
Immigrants | Eritrea
100.0
/100
|
#31
Exceptional
4.5%
Zimbabweans
100.0
/100
|
#32
Exceptional
4.5%
Carpatho Rusyns
100.0
/100
|
#33
Exceptional
4.5%
Belgians
100.0
/100
|
#34
Exceptional
4.5%
Germans
100.0
/100
|
#35
Exceptional
4.5%
Venezuelans
100.0
/100
|
#36
Exceptional
4.5%

Demographics Similar to Immigrants from St. Vincent and the Grenadines by Unemployment Among Ages 60 to 64 years

In terms of unemployment among ages 60 to 64 years, the demographic groups most similar to Immigrants from St. Vincent and the Grenadines are Immigrants from Grenada (5.9%, a difference of 0.060%), Paiute (5.8%, a difference of 0.94%), Immigrants from Ecuador (5.8%, a difference of 0.95%), Alsatian (5.8%, a difference of 1.3%), and Apache (6.0%, a difference of 1.4%).
DemographicsRating | RankUnemployment Among Ages 60 to 64 years
Immigrants | Belize
0.0
/100
|
#319
Tragic
5.7%
Colville
0.0
/100
|
#320
Tragic
5.7%
Dutch West Indians
0.0
/100
|
#321
Tragic
5.7%
Ecuadorians
0.0
/100
|
#322
Tragic
5.8%
Alsatians
0.0
/100
|
#323
Tragic
5.8%
Immigrants | Ecuador
0.0
/100
|
#324
Tragic
5.8%
Paiute
0.0
/100
|
#325
Tragic
5.8%
Immigrants | St. Vincent and the Grenadines
0.0
/100
|
#326
Tragic
5.9%
Immigrants | Grenada
0.0
/100
|
#327
Tragic
5.9%
Apache
0.0
/100
|
#328
Tragic
6.0%
Immigrants | Bangladesh
0.0
/100
|
#329
Tragic
6.0%
Immigrants | Armenia
0.0
/100
|
#330
Tragic
6.0%
Yakama
0.0
/100
|
#331
Tragic
6.0%
Dominicans
0.0
/100
|
#332
Tragic
6.0%
Immigrants | Dominican Republic
0.0
/100
|
#333
Tragic
6.0%