Northern European vs Immigrants from South Central Asia Male Unemployment
COMPARE
Northern European
Immigrants from South Central Asia
Male Unemployment
Male Unemployment Comparison
Northern Europeans
Immigrants from South Central Asia
4.9%
MALE UNEMPLOYMENT
99.3/ 100
METRIC RATING
40th/ 347
METRIC RANK
4.8%
MALE UNEMPLOYMENT
99.9/ 100
METRIC RATING
24th/ 347
METRIC RANK
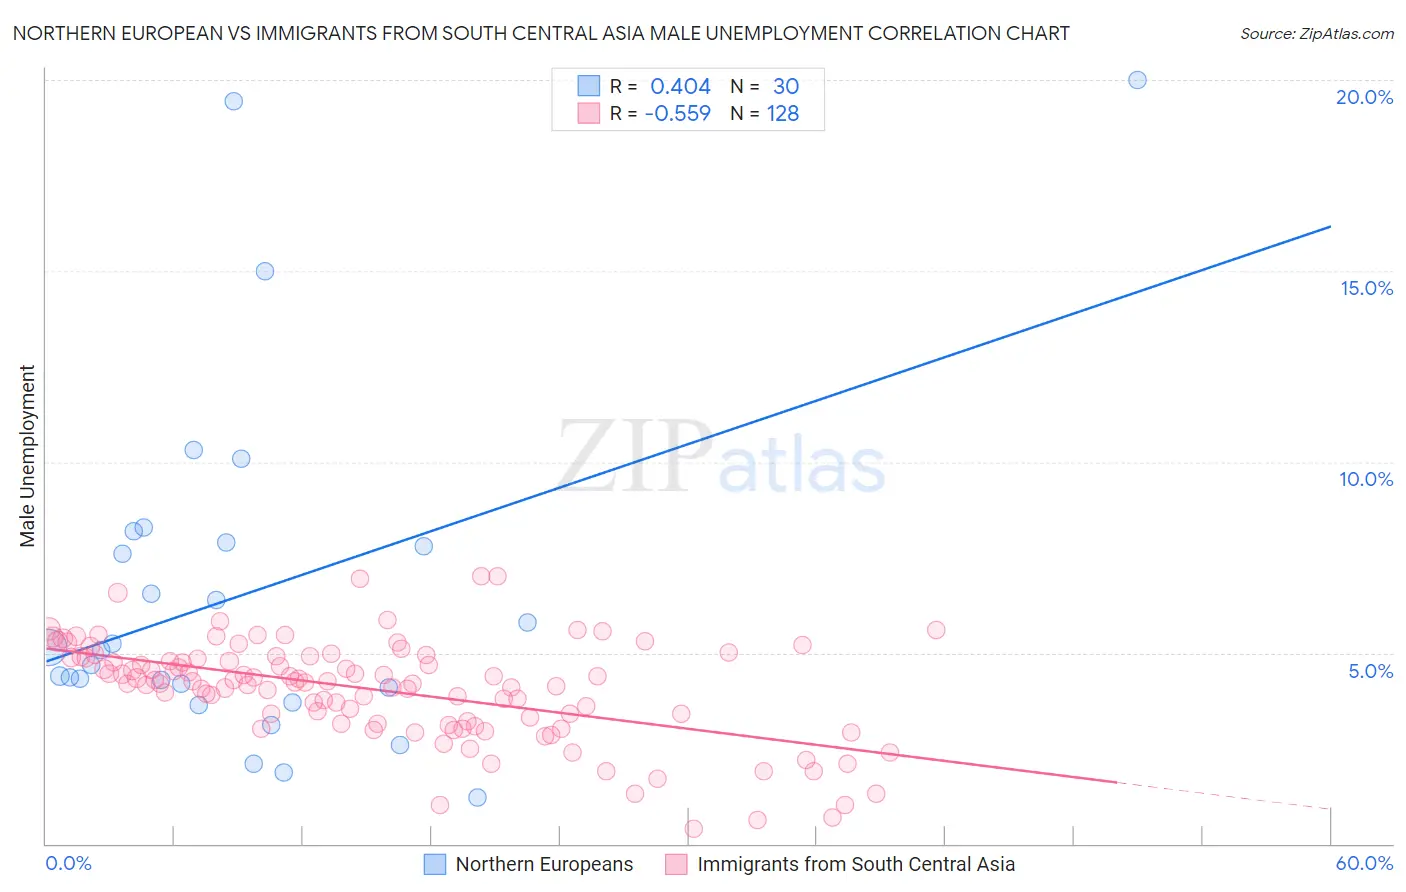
Northern European vs Immigrants from South Central Asia Male Unemployment Correlation Chart
The statistical analysis conducted on geographies consisting of 403,522,052 people shows a moderate positive correlation between the proportion of Northern Europeans and unemployment rate among males in the United States with a correlation coefficient (R) of 0.404 and weighted average of 4.9%. Similarly, the statistical analysis conducted on geographies consisting of 470,335,187 people shows a substantial negative correlation between the proportion of Immigrants from South Central Asia and unemployment rate among males in the United States with a correlation coefficient (R) of -0.559 and weighted average of 4.8%, a difference of 2.9%.
Male Unemployment Correlation Summary
| Measurement | Northern European | Immigrants from South Central Asia |
| Minimum | 1.2% | 0.40% |
| Maximum | 20.0% | 7.0% |
| Range | 18.8% | 6.6% |
| Mean | 6.6% | 4.0% |
| Median | 5.1% | 4.2% |
| Interquartile 25% (IQ1) | 4.1% | 3.2% |
| Interquartile 75% (IQ3) | 7.9% | 4.9% |
| Interquartile Range (IQR) | 3.8% | 1.7% |
| Standard Deviation (Sample) | 4.6% | 1.3% |
| Standard Deviation (Population) | 4.5% | 1.3% |
Demographics Similar to Northern Europeans and Immigrants from South Central Asia by Male Unemployment
In terms of male unemployment, the demographic groups most similar to Northern Europeans are Burmese (4.9%, a difference of 0.080%), Chinese (4.9%, a difference of 0.080%), Immigrants from Belgium (4.9%, a difference of 0.10%), Immigrants from Bosnia and Herzegovina (4.9%, a difference of 0.15%), and Scotch-Irish (4.9%, a difference of 0.17%). Similarly, the demographic groups most similar to Immigrants from South Central Asia are Tongan (4.8%, a difference of 0.030%), Carpatho Rusyn (4.8%, a difference of 0.070%), Zimbabwean (4.8%, a difference of 0.10%), Dutch (4.8%, a difference of 0.12%), and Belgian (4.8%, a difference of 0.32%).
| Demographics | Rating | Rank | Male Unemployment |
| Carpatho Rusyns | 99.9 /100 | #22 | Exceptional 4.8% |
| Tongans | 99.9 /100 | #23 | Exceptional 4.8% |
| Immigrants | South Central Asia | 99.9 /100 | #24 | Exceptional 4.8% |
| Zimbabweans | 99.9 /100 | #25 | Exceptional 4.8% |
| Dutch | 99.9 /100 | #26 | Exceptional 4.8% |
| Belgians | 99.9 /100 | #27 | Exceptional 4.8% |
| Bulgarians | 99.8 /100 | #28 | Exceptional 4.8% |
| Scottish | 99.8 /100 | #29 | Exceptional 4.8% |
| British | 99.8 /100 | #30 | Exceptional 4.8% |
| Sudanese | 99.8 /100 | #31 | Exceptional 4.8% |
| Immigrants | Nepal | 99.8 /100 | #32 | Exceptional 4.8% |
| Latvians | 99.7 /100 | #33 | Exceptional 4.8% |
| Welsh | 99.7 /100 | #34 | Exceptional 4.8% |
| Paraguayans | 99.5 /100 | #35 | Exceptional 4.9% |
| Immigrants | Singapore | 99.4 /100 | #36 | Exceptional 4.9% |
| Scotch-Irish | 99.4 /100 | #37 | Exceptional 4.9% |
| Immigrants | Bosnia and Herzegovina | 99.4 /100 | #38 | Exceptional 4.9% |
| Burmese | 99.3 /100 | #39 | Exceptional 4.9% |
| Northern Europeans | 99.3 /100 | #40 | Exceptional 4.9% |
| Chinese | 99.3 /100 | #41 | Exceptional 4.9% |
| Immigrants | Belgium | 99.2 /100 | #42 | Exceptional 4.9% |