Immigrants vs Immigrants from South Central Asia Male Unemployment
COMPARE
Immigrants
Immigrants from South Central Asia
Male Unemployment
Male Unemployment Comparison
Immigrants
Immigrants from South Central Asia
5.5%
MALE UNEMPLOYMENT
4.3/ 100
METRIC RATING
216th/ 347
METRIC RANK
4.8%
MALE UNEMPLOYMENT
99.9/ 100
METRIC RATING
24th/ 347
METRIC RANK
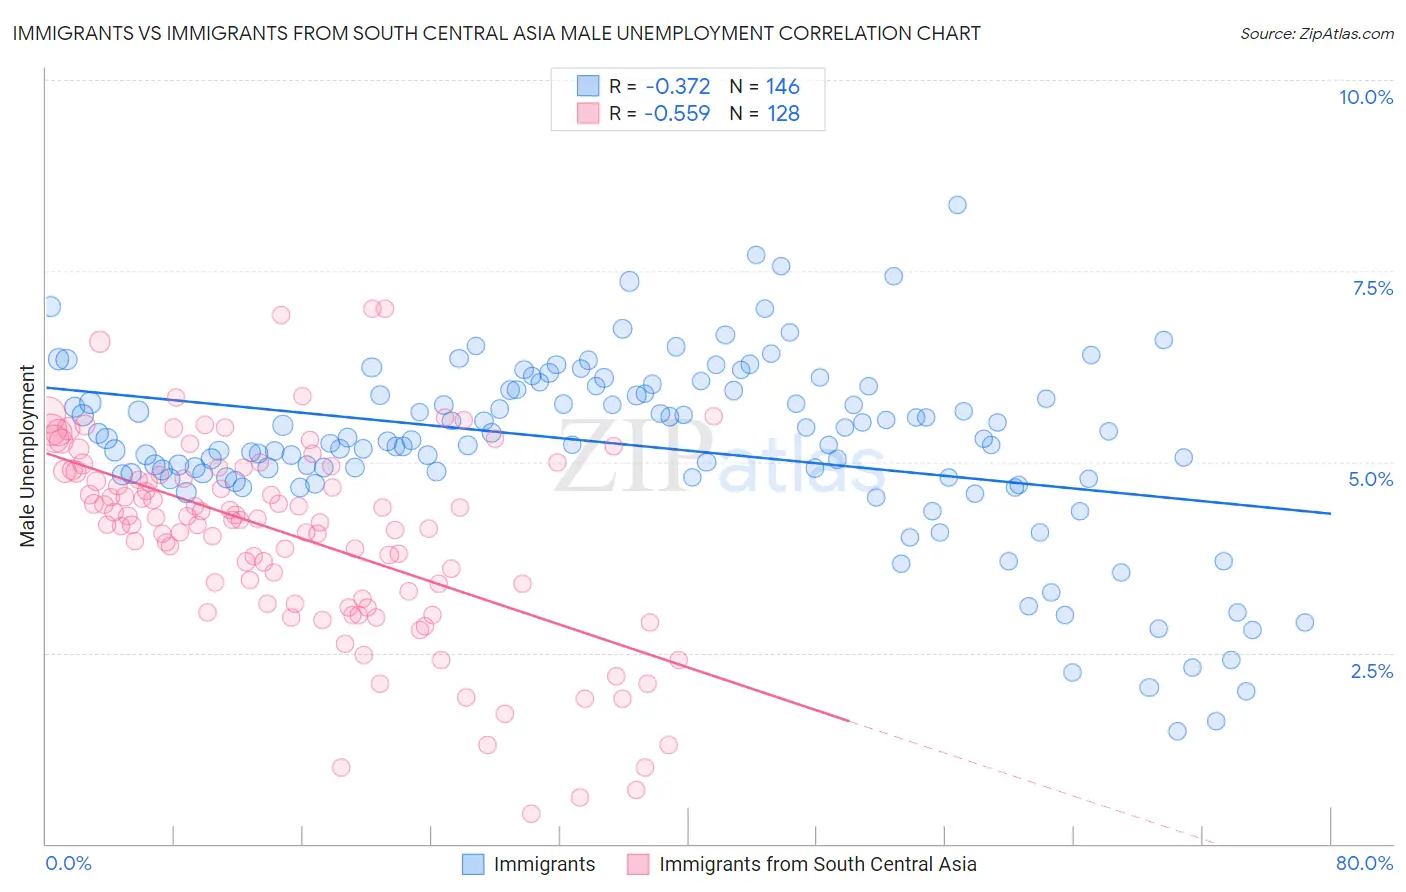
Immigrants vs Immigrants from South Central Asia Male Unemployment Correlation Chart
The statistical analysis conducted on geographies consisting of 566,323,513 people shows a mild negative correlation between the proportion of Immigrants and unemployment rate among males in the United States with a correlation coefficient (R) of -0.372 and weighted average of 5.5%. Similarly, the statistical analysis conducted on geographies consisting of 470,335,187 people shows a substantial negative correlation between the proportion of Immigrants from South Central Asia and unemployment rate among males in the United States with a correlation coefficient (R) of -0.559 and weighted average of 4.8%, a difference of 16.0%.
Male Unemployment Correlation Summary
| Measurement | Immigrants | Immigrants from South Central Asia |
| Minimum | 1.5% | 0.40% |
| Maximum | 8.4% | 7.0% |
| Range | 6.9% | 6.6% |
| Mean | 5.2% | 4.0% |
| Median | 5.3% | 4.2% |
| Interquartile 25% (IQ1) | 4.8% | 3.2% |
| Interquartile 75% (IQ3) | 5.9% | 4.9% |
| Interquartile Range (IQR) | 1.1% | 1.7% |
| Standard Deviation (Sample) | 1.2% | 1.3% |
| Standard Deviation (Population) | 1.2% | 1.3% |
Similar Demographics by Male Unemployment
Demographics Similar to Immigrants by Male Unemployment
In terms of male unemployment, the demographic groups most similar to Immigrants are Delaware (5.5%, a difference of 0.050%), Samoan (5.5%, a difference of 0.17%), Immigrants from Albania (5.5%, a difference of 0.26%), Immigrants from Western Asia (5.6%, a difference of 0.31%), and Portuguese (5.6%, a difference of 0.33%).
| Demographics | Rating | Rank | Male Unemployment |
| Immigrants | Middle Africa | 8.3 /100 | #209 | Tragic 5.5% |
| South American Indians | 7.6 /100 | #210 | Tragic 5.5% |
| Israelis | 7.4 /100 | #211 | Tragic 5.5% |
| Hmong | 7.0 /100 | #212 | Tragic 5.5% |
| Ugandans | 6.3 /100 | #213 | Tragic 5.5% |
| Puget Sound Salish | 5.6 /100 | #214 | Tragic 5.5% |
| Samoans | 4.9 /100 | #215 | Tragic 5.5% |
| Immigrants | Immigrants | 4.3 /100 | #216 | Tragic 5.5% |
| Delaware | 4.2 /100 | #217 | Tragic 5.5% |
| Immigrants | Albania | 3.6 /100 | #218 | Tragic 5.5% |
| Immigrants | Western Asia | 3.5 /100 | #219 | Tragic 5.6% |
| Portuguese | 3.5 /100 | #220 | Tragic 5.6% |
| Soviet Union | 3.2 /100 | #221 | Tragic 5.6% |
| Immigrants | Micronesia | 2.9 /100 | #222 | Tragic 5.6% |
| Creek | 2.6 /100 | #223 | Tragic 5.6% |
Demographics Similar to Immigrants from South Central Asia by Male Unemployment
In terms of male unemployment, the demographic groups most similar to Immigrants from South Central Asia are Tongan (4.8%, a difference of 0.030%), Carpatho Rusyn (4.8%, a difference of 0.070%), Immigrants from Taiwan (4.8%, a difference of 0.090%), Zimbabwean (4.8%, a difference of 0.10%), and Dutch (4.8%, a difference of 0.12%).
| Demographics | Rating | Rank | Male Unemployment |
| Filipinos | 99.9 /100 | #17 | Exceptional 4.7% |
| English | 99.9 /100 | #18 | Exceptional 4.8% |
| Europeans | 99.9 /100 | #19 | Exceptional 4.8% |
| Pennsylvania Germans | 99.9 /100 | #20 | Exceptional 4.8% |
| Immigrants | Taiwan | 99.9 /100 | #21 | Exceptional 4.8% |
| Carpatho Rusyns | 99.9 /100 | #22 | Exceptional 4.8% |
| Tongans | 99.9 /100 | #23 | Exceptional 4.8% |
| Immigrants | South Central Asia | 99.9 /100 | #24 | Exceptional 4.8% |
| Zimbabweans | 99.9 /100 | #25 | Exceptional 4.8% |
| Dutch | 99.9 /100 | #26 | Exceptional 4.8% |
| Belgians | 99.9 /100 | #27 | Exceptional 4.8% |
| Bulgarians | 99.8 /100 | #28 | Exceptional 4.8% |
| Scottish | 99.8 /100 | #29 | Exceptional 4.8% |
| British | 99.8 /100 | #30 | Exceptional 4.8% |
| Sudanese | 99.8 /100 | #31 | Exceptional 4.8% |