Nonimmigrants vs Immigrants from Moldova Male Unemployment
COMPARE
Nonimmigrants
Immigrants from Moldova
Male Unemployment
Male Unemployment Comparison
Nonimmigrants
Immigrants from Moldova
5.4%
MALE UNEMPLOYMENT
13.1/ 100
METRIC RATING
202nd/ 347
METRIC RANK
5.1%
MALE UNEMPLOYMENT
90.3/ 100
METRIC RATING
112th/ 347
METRIC RANK
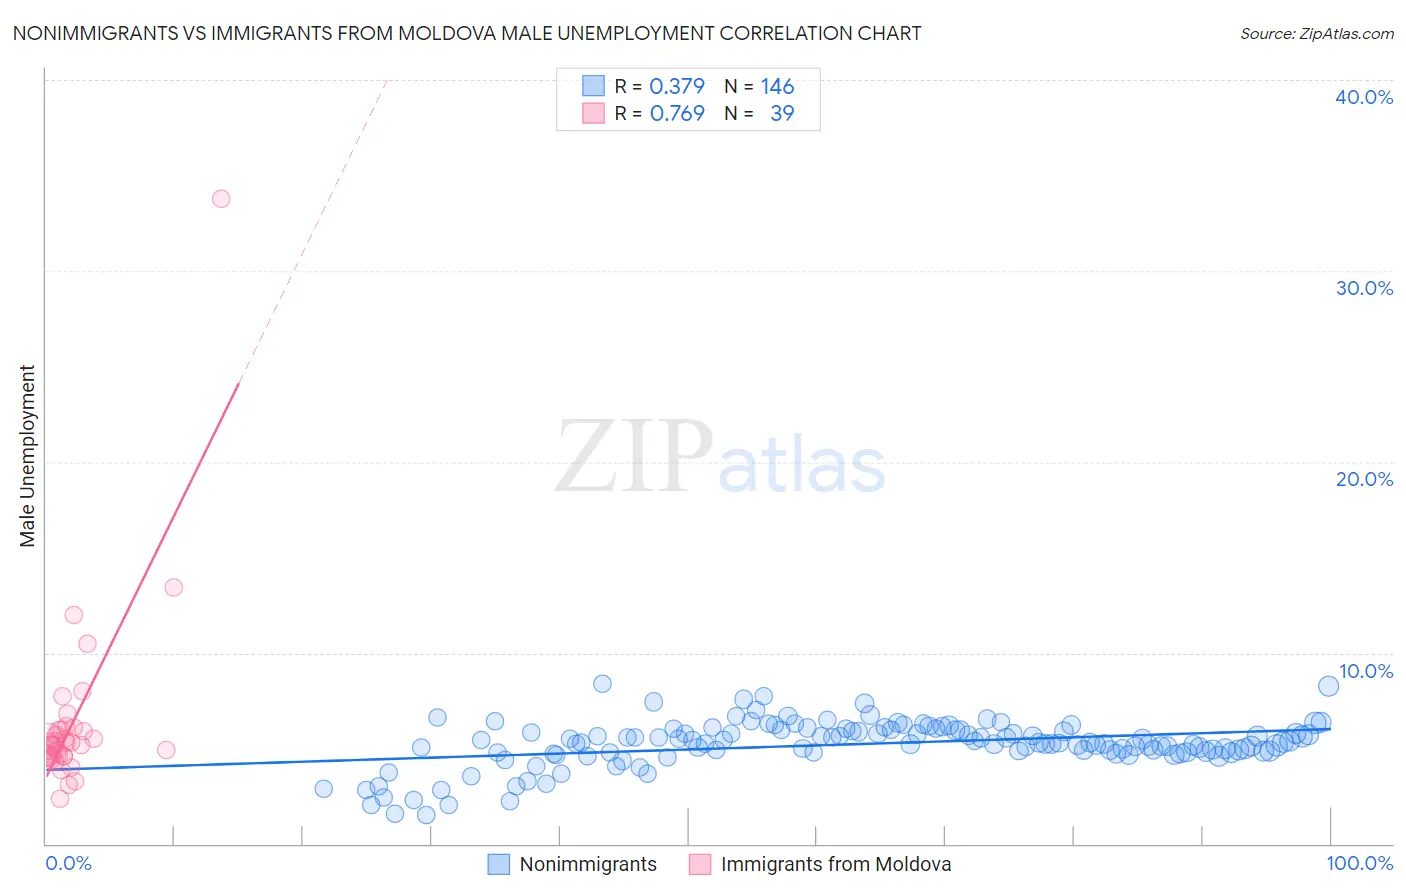
Nonimmigrants vs Immigrants from Moldova Male Unemployment Correlation Chart
The statistical analysis conducted on geographies consisting of 570,841,743 people shows a mild positive correlation between the proportion of Nonimmigrants and unemployment rate among males in the United States with a correlation coefficient (R) of 0.379 and weighted average of 5.4%. Similarly, the statistical analysis conducted on geographies consisting of 124,231,836 people shows a strong positive correlation between the proportion of Immigrants from Moldova and unemployment rate among males in the United States with a correlation coefficient (R) of 0.769 and weighted average of 5.1%, a difference of 6.2%.
Male Unemployment Correlation Summary
| Measurement | Nonimmigrants | Immigrants from Moldova |
| Minimum | 1.5% | 2.4% |
| Maximum | 8.4% | 33.8% |
| Range | 6.9% | 31.4% |
| Mean | 5.2% | 6.4% |
| Median | 5.3% | 5.3% |
| Interquartile 25% (IQ1) | 4.8% | 4.6% |
| Interquartile 75% (IQ3) | 5.9% | 6.0% |
| Interquartile Range (IQR) | 1.1% | 1.4% |
| Standard Deviation (Sample) | 1.2% | 5.0% |
| Standard Deviation (Population) | 1.2% | 4.9% |
Similar Demographics by Male Unemployment
Demographics Similar to Nonimmigrants by Male Unemployment
In terms of male unemployment, the demographic groups most similar to Nonimmigrants are Immigrants from Laos (5.4%, a difference of 0.010%), Immigrants from Philippines (5.4%, a difference of 0.040%), Immigrants from Zaire (5.4%, a difference of 0.070%), Guamanian/Chamorro (5.4%, a difference of 0.10%), and Immigrants from Greece (5.4%, a difference of 0.16%).
| Demographics | Rating | Rank | Male Unemployment |
| Immigrants | Southern Europe | 17.7 /100 | #195 | Poor 5.4% |
| Albanians | 17.3 /100 | #196 | Poor 5.4% |
| Alsatians | 16.7 /100 | #197 | Poor 5.4% |
| Immigrants | Thailand | 14.7 /100 | #198 | Poor 5.4% |
| Immigrants | Greece | 14.5 /100 | #199 | Poor 5.4% |
| Immigrants | Zaire | 13.7 /100 | #200 | Poor 5.4% |
| Immigrants | Philippines | 13.5 /100 | #201 | Poor 5.4% |
| Immigrants | Nonimmigrants | 13.1 /100 | #202 | Poor 5.4% |
| Immigrants | Laos | 13.0 /100 | #203 | Poor 5.4% |
| Guamanians/Chamorros | 12.3 /100 | #204 | Poor 5.4% |
| Immigrants | Costa Rica | 11.4 /100 | #205 | Poor 5.5% |
| Immigrants | Ukraine | 9.9 /100 | #206 | Tragic 5.5% |
| Immigrants | Syria | 9.3 /100 | #207 | Tragic 5.5% |
| Immigrants | Lebanon | 8.6 /100 | #208 | Tragic 5.5% |
| Immigrants | Middle Africa | 8.3 /100 | #209 | Tragic 5.5% |
Demographics Similar to Immigrants from Moldova by Male Unemployment
In terms of male unemployment, the demographic groups most similar to Immigrants from Moldova are Immigrants from Austria (5.1%, a difference of 0.010%), Immigrants from Eastern Asia (5.1%, a difference of 0.080%), Romanian (5.1%, a difference of 0.080%), Immigrants from England (5.1%, a difference of 0.090%), and Immigrants from Pakistan (5.1%, a difference of 0.11%).
| Demographics | Rating | Rank | Male Unemployment |
| Immigrants | Czechoslovakia | 91.7 /100 | #105 | Exceptional 5.1% |
| Immigrants | Ethiopia | 91.5 /100 | #106 | Exceptional 5.1% |
| Ethiopians | 91.3 /100 | #107 | Exceptional 5.1% |
| Immigrants | Nicaragua | 91.2 /100 | #108 | Exceptional 5.1% |
| Immigrants | Pakistan | 90.9 /100 | #109 | Exceptional 5.1% |
| Immigrants | England | 90.8 /100 | #110 | Exceptional 5.1% |
| Immigrants | Eastern Asia | 90.8 /100 | #111 | Exceptional 5.1% |
| Immigrants | Moldova | 90.3 /100 | #112 | Exceptional 5.1% |
| Immigrants | Austria | 90.3 /100 | #113 | Exceptional 5.1% |
| Romanians | 89.8 /100 | #114 | Excellent 5.1% |
| Immigrants | Asia | 89.6 /100 | #115 | Excellent 5.1% |
| Immigrants | Denmark | 89.4 /100 | #116 | Excellent 5.1% |
| Estonians | 89.0 /100 | #117 | Excellent 5.1% |
| Cypriots | 88.8 /100 | #118 | Excellent 5.1% |
| French Canadians | 88.6 /100 | #119 | Excellent 5.1% |