Native/Alaskan vs Serbian Unemployment Among Seniors over 65 years
COMPARE
Native/Alaskan
Serbian
Unemployment Among Seniors over 65 years
Unemployment Among Seniors over 65 years Comparison
Natives/Alaskans
Serbians
5.8%
UNEMPLOYMENT AMONG SENIORS OVER 65 YEARS
0.0/ 100
METRIC RATING
322nd/ 347
METRIC RANK
5.0%
UNEMPLOYMENT AMONG SENIORS OVER 65 YEARS
98.4/ 100
METRIC RATING
82nd/ 347
METRIC RANK
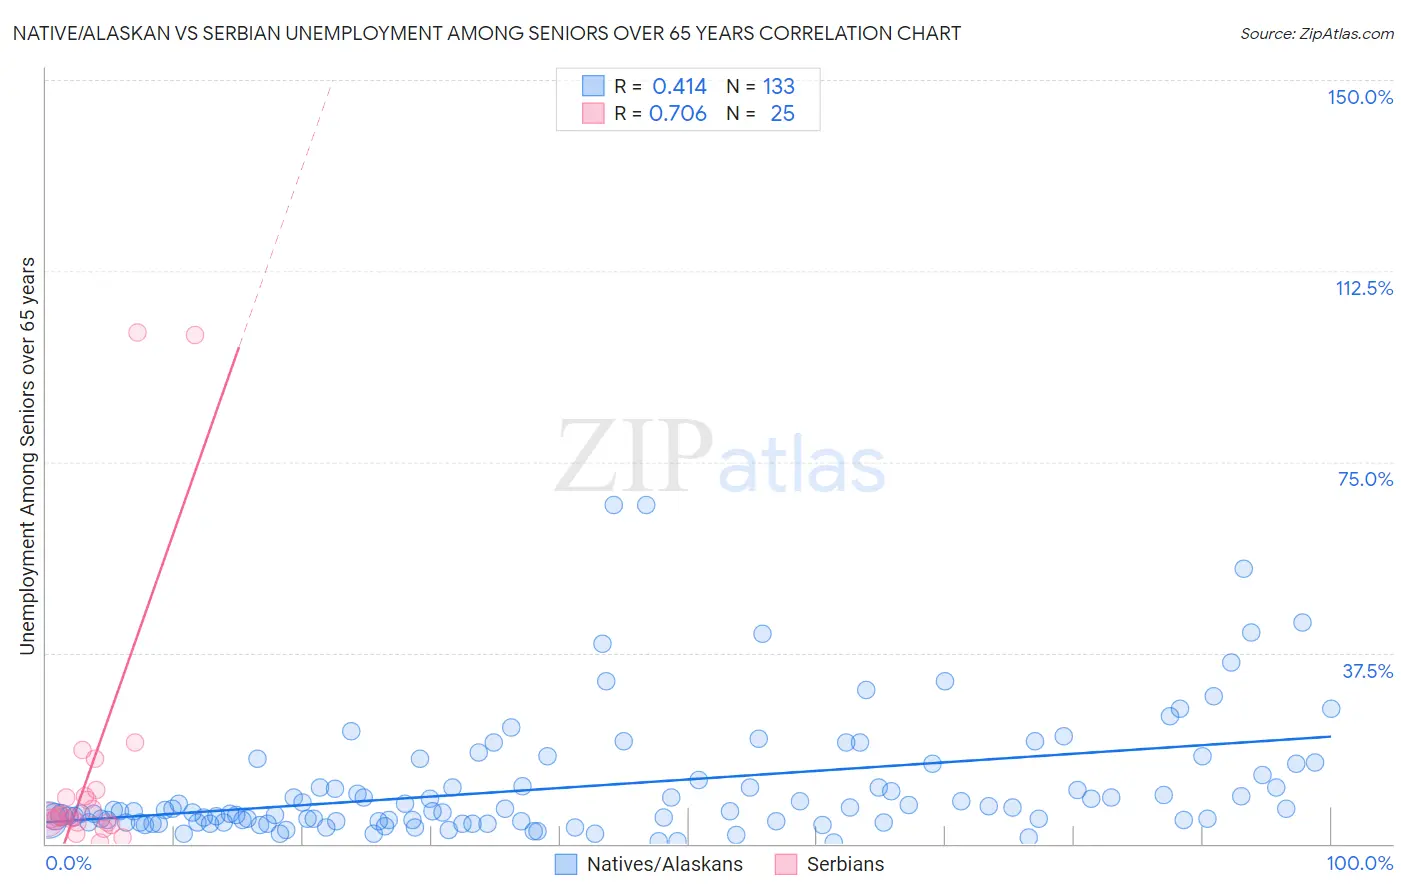
Native/Alaskan vs Serbian Unemployment Among Seniors over 65 years Correlation Chart
The statistical analysis conducted on geographies consisting of 433,164,375 people shows a moderate positive correlation between the proportion of Natives/Alaskans and unemployment rate amomg seniors over the age of 65 in the United States with a correlation coefficient (R) of 0.414 and weighted average of 5.8%. Similarly, the statistical analysis conducted on geographies consisting of 247,718,155 people shows a strong positive correlation between the proportion of Serbians and unemployment rate amomg seniors over the age of 65 in the United States with a correlation coefficient (R) of 0.706 and weighted average of 5.0%, a difference of 15.9%.
Unemployment Among Seniors over 65 years Correlation Summary
| Measurement | Native/Alaskan | Serbian |
| Minimum | 0.30% | 0.30% |
| Maximum | 66.6% | 100.4% |
| Range | 66.3% | 100.1% |
| Mean | 11.3% | 14.4% |
| Median | 6.5% | 5.2% |
| Interquartile 25% (IQ1) | 4.3% | 4.2% |
| Interquartile 75% (IQ3) | 12.9% | 10.0% |
| Interquartile Range (IQR) | 8.7% | 5.8% |
| Standard Deviation (Sample) | 12.1% | 26.3% |
| Standard Deviation (Population) | 12.0% | 25.8% |
Similar Demographics by Unemployment Among Seniors over 65 years
Demographics Similar to Natives/Alaskans by Unemployment Among Seniors over 65 years
In terms of unemployment among seniors over 65 years, the demographic groups most similar to Natives/Alaskans are British West Indian (5.8%, a difference of 0.080%), Immigrants from Dominica (5.8%, a difference of 0.34%), Yuman (5.8%, a difference of 0.51%), Immigrants from Mexico (5.7%, a difference of 0.72%), and Immigrants from Bangladesh (5.7%, a difference of 0.88%).
| Demographics | Rating | Rank | Unemployment Among Seniors over 65 years |
| Immigrants | El Salvador | 0.0 /100 | #315 | Tragic 5.7% |
| Immigrants | Central America | 0.0 /100 | #316 | Tragic 5.7% |
| Immigrants | Bahamas | 0.0 /100 | #317 | Tragic 5.7% |
| Vietnamese | 0.0 /100 | #318 | Tragic 5.7% |
| Immigrants | Bangladesh | 0.0 /100 | #319 | Tragic 5.7% |
| Immigrants | Mexico | 0.0 /100 | #320 | Tragic 5.7% |
| British West Indians | 0.0 /100 | #321 | Tragic 5.8% |
| Natives/Alaskans | 0.0 /100 | #322 | Tragic 5.8% |
| Immigrants | Dominica | 0.0 /100 | #323 | Tragic 5.8% |
| Yuman | 0.0 /100 | #324 | Tragic 5.8% |
| Inupiat | 0.0 /100 | #325 | Tragic 5.8% |
| Shoshone | 0.0 /100 | #326 | Tragic 5.9% |
| Bermudans | 0.0 /100 | #327 | Tragic 5.9% |
| Puerto Ricans | 0.0 /100 | #328 | Tragic 5.9% |
| Dominicans | 0.0 /100 | #329 | Tragic 6.0% |
Demographics Similar to Serbians by Unemployment Among Seniors over 65 years
In terms of unemployment among seniors over 65 years, the demographic groups most similar to Serbians are Estonian (5.0%, a difference of 0.030%), Immigrants from Zimbabwe (5.0%, a difference of 0.030%), Filipino (5.0%, a difference of 0.040%), Immigrants from Hungary (5.0%, a difference of 0.10%), and Immigrants from Taiwan (5.0%, a difference of 0.11%).
| Demographics | Rating | Rank | Unemployment Among Seniors over 65 years |
| British | 99.1 /100 | #75 | Exceptional 4.9% |
| Welsh | 99.1 /100 | #76 | Exceptional 5.0% |
| Thais | 99.1 /100 | #77 | Exceptional 5.0% |
| Slavs | 98.9 /100 | #78 | Exceptional 5.0% |
| Immigrants | Netherlands | 98.8 /100 | #79 | Exceptional 5.0% |
| Immigrants | Ethiopia | 98.6 /100 | #80 | Exceptional 5.0% |
| Estonians | 98.5 /100 | #81 | Exceptional 5.0% |
| Serbians | 98.4 /100 | #82 | Exceptional 5.0% |
| Immigrants | Zimbabwe | 98.3 /100 | #83 | Exceptional 5.0% |
| Filipinos | 98.3 /100 | #84 | Exceptional 5.0% |
| Immigrants | Hungary | 98.2 /100 | #85 | Exceptional 5.0% |
| Immigrants | Taiwan | 98.2 /100 | #86 | Exceptional 5.0% |
| Immigrants | Switzerland | 98.2 /100 | #87 | Exceptional 5.0% |
| Afghans | 97.6 /100 | #88 | Exceptional 5.0% |
| Immigrants | South Central Asia | 97.6 /100 | #89 | Exceptional 5.0% |