Native/Alaskan vs Bangladeshi Unemployment Among Seniors over 65 years
COMPARE
Native/Alaskan
Bangladeshi
Unemployment Among Seniors over 65 years
Unemployment Among Seniors over 65 years Comparison
Natives/Alaskans
Bangladeshis
5.8%
UNEMPLOYMENT AMONG SENIORS OVER 65 YEARS
0.0/ 100
METRIC RATING
322nd/ 347
METRIC RANK
5.2%
UNEMPLOYMENT AMONG SENIORS OVER 65 YEARS
32.3/ 100
METRIC RATING
189th/ 347
METRIC RANK
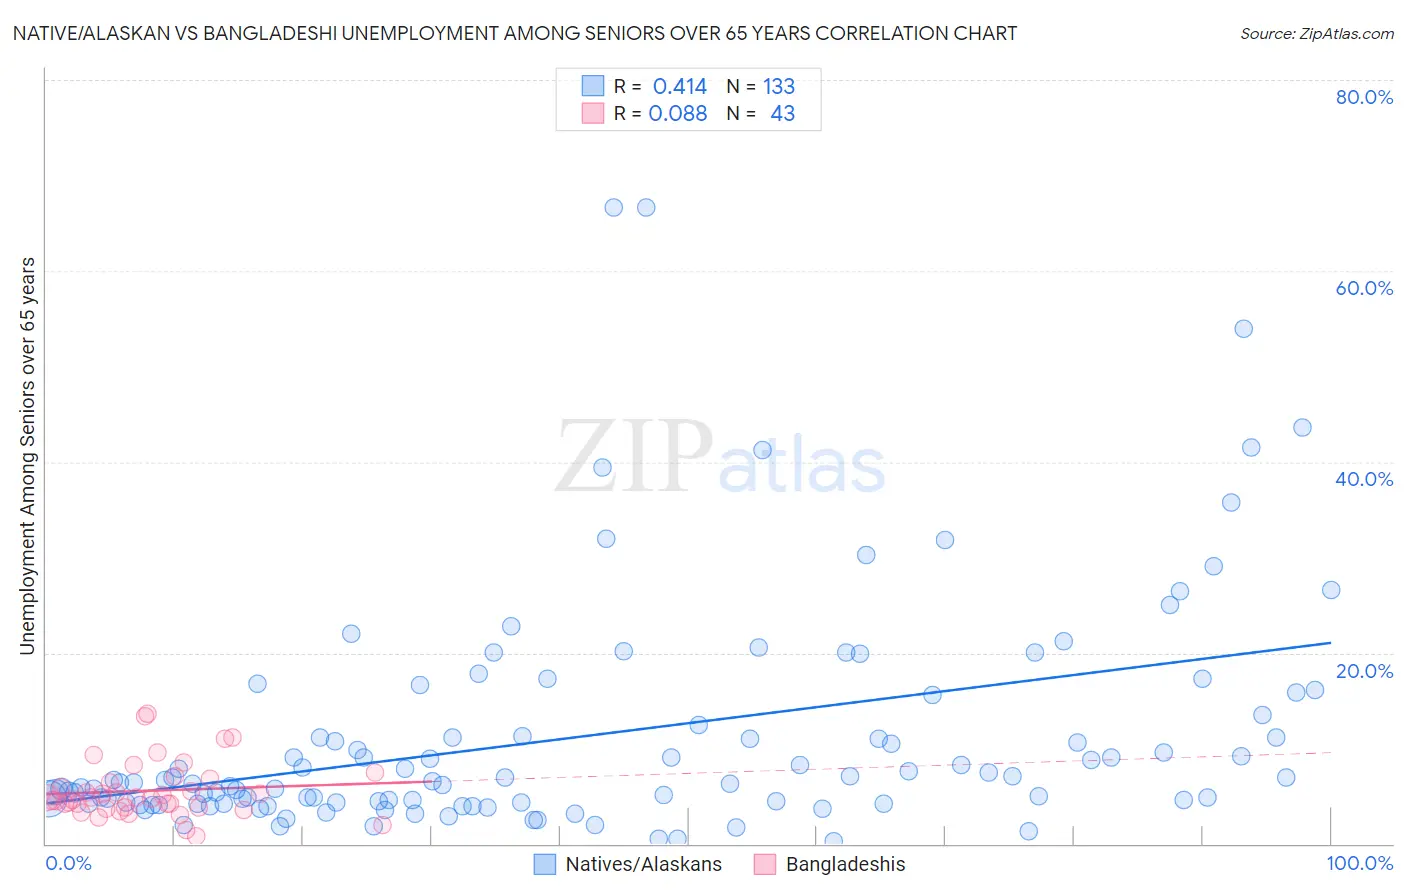
Native/Alaskan vs Bangladeshi Unemployment Among Seniors over 65 years Correlation Chart
The statistical analysis conducted on geographies consisting of 433,164,375 people shows a moderate positive correlation between the proportion of Natives/Alaskans and unemployment rate amomg seniors over the age of 65 in the United States with a correlation coefficient (R) of 0.414 and weighted average of 5.8%. Similarly, the statistical analysis conducted on geographies consisting of 132,453,489 people shows a slight positive correlation between the proportion of Bangladeshis and unemployment rate amomg seniors over the age of 65 in the United States with a correlation coefficient (R) of 0.088 and weighted average of 5.2%, a difference of 11.5%.
Unemployment Among Seniors over 65 years Correlation Summary
| Measurement | Native/Alaskan | Bangladeshi |
| Minimum | 0.30% | 0.80% |
| Maximum | 66.6% | 13.6% |
| Range | 66.3% | 12.8% |
| Mean | 11.3% | 5.6% |
| Median | 6.5% | 4.8% |
| Interquartile 25% (IQ1) | 4.3% | 3.8% |
| Interquartile 75% (IQ3) | 12.9% | 6.8% |
| Interquartile Range (IQR) | 8.7% | 3.0% |
| Standard Deviation (Sample) | 12.1% | 2.9% |
| Standard Deviation (Population) | 12.0% | 2.9% |
Similar Demographics by Unemployment Among Seniors over 65 years
Demographics Similar to Natives/Alaskans by Unemployment Among Seniors over 65 years
In terms of unemployment among seniors over 65 years, the demographic groups most similar to Natives/Alaskans are British West Indian (5.8%, a difference of 0.080%), Immigrants from Dominica (5.8%, a difference of 0.34%), Yuman (5.8%, a difference of 0.51%), Immigrants from Mexico (5.7%, a difference of 0.72%), and Immigrants from Bangladesh (5.7%, a difference of 0.88%).
| Demographics | Rating | Rank | Unemployment Among Seniors over 65 years |
| Immigrants | El Salvador | 0.0 /100 | #315 | Tragic 5.7% |
| Immigrants | Central America | 0.0 /100 | #316 | Tragic 5.7% |
| Immigrants | Bahamas | 0.0 /100 | #317 | Tragic 5.7% |
| Vietnamese | 0.0 /100 | #318 | Tragic 5.7% |
| Immigrants | Bangladesh | 0.0 /100 | #319 | Tragic 5.7% |
| Immigrants | Mexico | 0.0 /100 | #320 | Tragic 5.7% |
| British West Indians | 0.0 /100 | #321 | Tragic 5.8% |
| Natives/Alaskans | 0.0 /100 | #322 | Tragic 5.8% |
| Immigrants | Dominica | 0.0 /100 | #323 | Tragic 5.8% |
| Yuman | 0.0 /100 | #324 | Tragic 5.8% |
| Inupiat | 0.0 /100 | #325 | Tragic 5.8% |
| Shoshone | 0.0 /100 | #326 | Tragic 5.9% |
| Bermudans | 0.0 /100 | #327 | Tragic 5.9% |
| Puerto Ricans | 0.0 /100 | #328 | Tragic 5.9% |
| Dominicans | 0.0 /100 | #329 | Tragic 6.0% |
Demographics Similar to Bangladeshis by Unemployment Among Seniors over 65 years
In terms of unemployment among seniors over 65 years, the demographic groups most similar to Bangladeshis are Korean (5.2%, a difference of 0.030%), Immigrants from Egypt (5.2%, a difference of 0.040%), Somali (5.2%, a difference of 0.050%), Immigrants from Denmark (5.2%, a difference of 0.050%), and Sioux (5.2%, a difference of 0.050%).
| Demographics | Rating | Rank | Unemployment Among Seniors over 65 years |
| Panamanians | 43.0 /100 | #182 | Average 5.2% |
| Immigrants | Western Asia | 42.1 /100 | #183 | Average 5.2% |
| Immigrants | Serbia | 41.6 /100 | #184 | Average 5.2% |
| Immigrants | Iran | 36.0 /100 | #185 | Fair 5.2% |
| Americans | 35.1 /100 | #186 | Fair 5.2% |
| Somalis | 33.5 /100 | #187 | Fair 5.2% |
| Immigrants | Egypt | 33.2 /100 | #188 | Fair 5.2% |
| Bangladeshis | 32.3 /100 | #189 | Fair 5.2% |
| Koreans | 31.6 /100 | #190 | Fair 5.2% |
| Immigrants | Denmark | 31.0 /100 | #191 | Fair 5.2% |
| Sioux | 30.8 /100 | #192 | Fair 5.2% |
| Immigrants | Africa | 29.6 /100 | #193 | Fair 5.2% |
| Argentineans | 29.1 /100 | #194 | Fair 5.2% |
| Costa Ricans | 27.0 /100 | #195 | Fair 5.2% |
| Immigrants | Poland | 24.3 /100 | #196 | Fair 5.2% |