Native/Alaskan vs Latvian Female Unemployment
COMPARE
Native/Alaskan
Latvian
Female Unemployment
Female Unemployment Comparison
Natives/Alaskans
Latvians
6.6%
FEMALE UNEMPLOYMENT
0.0/ 100
METRIC RATING
326th/ 347
METRIC RANK
4.7%
FEMALE UNEMPLOYMENT
99.9/ 100
METRIC RATING
18th/ 347
METRIC RANK
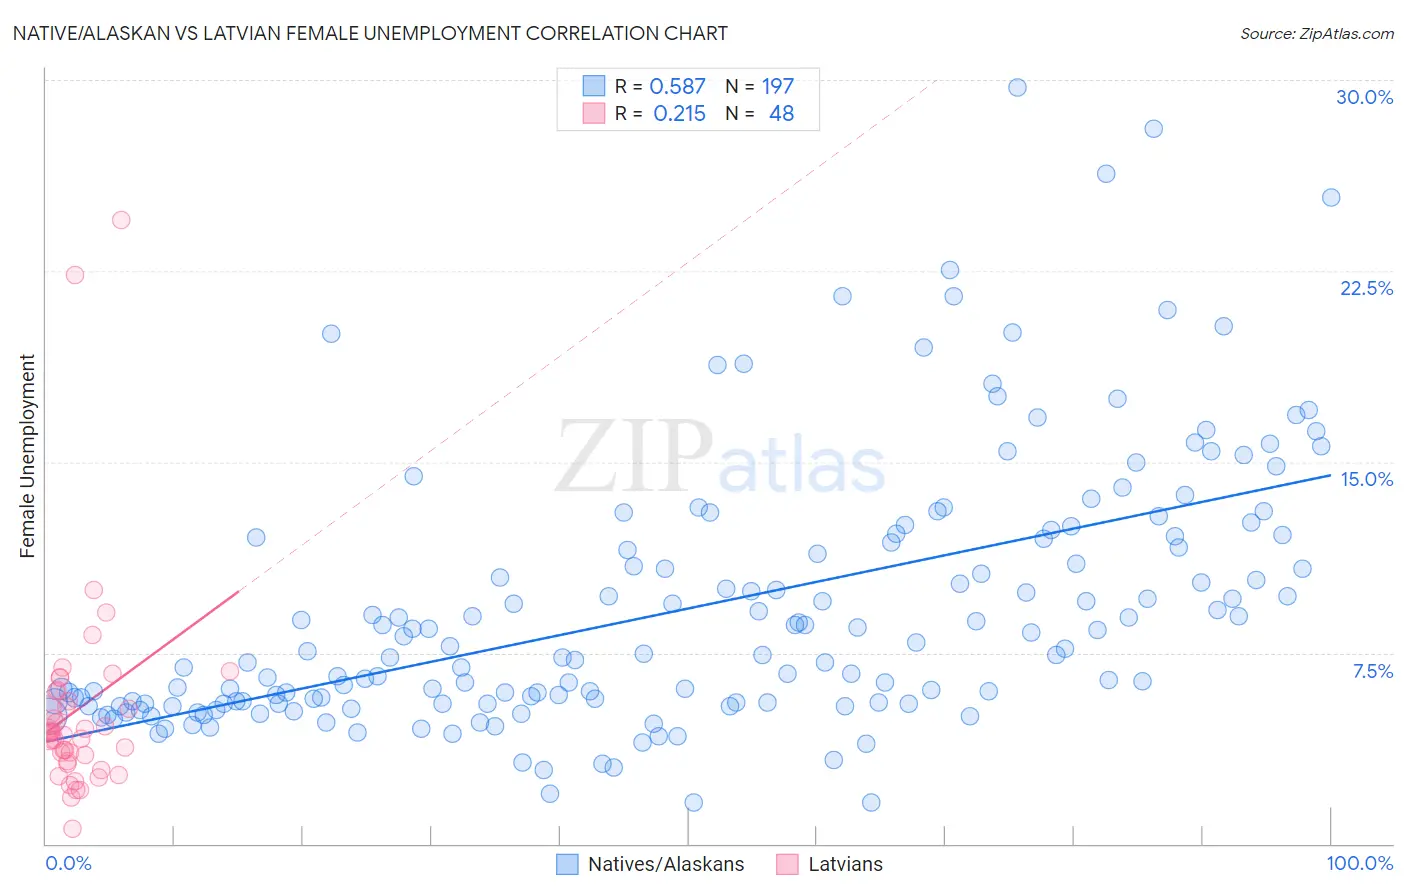
Native/Alaskan vs Latvian Female Unemployment Correlation Chart
The statistical analysis conducted on geographies consisting of 506,227,982 people shows a substantial positive correlation between the proportion of Natives/Alaskans and unemploymnet rate among females in the United States with a correlation coefficient (R) of 0.587 and weighted average of 6.6%. Similarly, the statistical analysis conducted on geographies consisting of 220,201,927 people shows a weak positive correlation between the proportion of Latvians and unemploymnet rate among females in the United States with a correlation coefficient (R) of 0.215 and weighted average of 4.7%, a difference of 41.5%.
Female Unemployment Correlation Summary
| Measurement | Native/Alaskan | Latvian |
| Minimum | 1.6% | 0.60% |
| Maximum | 29.7% | 24.5% |
| Range | 28.1% | 23.9% |
| Mean | 9.2% | 5.3% |
| Median | 7.5% | 4.3% |
| Interquartile 25% (IQ1) | 5.5% | 3.4% |
| Interquartile 75% (IQ3) | 12.0% | 5.8% |
| Interquartile Range (IQR) | 6.5% | 2.4% |
| Standard Deviation (Sample) | 5.2% | 4.3% |
| Standard Deviation (Population) | 5.2% | 4.2% |
Similar Demographics by Female Unemployment
Demographics Similar to Natives/Alaskans by Female Unemployment
In terms of female unemployment, the demographic groups most similar to Natives/Alaskans are Alaska Native (6.6%, a difference of 0.090%), Guyanese (6.7%, a difference of 0.52%), Apache (6.6%, a difference of 0.56%), Cheyenne (6.6%, a difference of 0.83%), and Immigrants from Guyana (6.7%, a difference of 0.89%).
| Demographics | Rating | Rank | Female Unemployment |
| Immigrants | Bangladesh | 0.0 /100 | #319 | Tragic 6.5% |
| Immigrants | Dominica | 0.0 /100 | #320 | Tragic 6.5% |
| Blacks/African Americans | 0.0 /100 | #321 | Tragic 6.5% |
| Vietnamese | 0.0 /100 | #322 | Tragic 6.5% |
| Immigrants | Belize | 0.0 /100 | #323 | Tragic 6.5% |
| Cheyenne | 0.0 /100 | #324 | Tragic 6.6% |
| Apache | 0.0 /100 | #325 | Tragic 6.6% |
| Natives/Alaskans | 0.0 /100 | #326 | Tragic 6.6% |
| Alaska Natives | 0.0 /100 | #327 | Tragic 6.6% |
| Guyanese | 0.0 /100 | #328 | Tragic 6.7% |
| Immigrants | Guyana | 0.0 /100 | #329 | Tragic 6.7% |
| Yakama | 0.0 /100 | #330 | Tragic 6.7% |
| Paiute | 0.0 /100 | #331 | Tragic 6.8% |
| Sioux | 0.0 /100 | #332 | Tragic 7.0% |
| Menominee | 0.0 /100 | #333 | Tragic 7.0% |
Demographics Similar to Latvians by Female Unemployment
In terms of female unemployment, the demographic groups most similar to Latvians are Polish (4.7%, a difference of 0.010%), Bulgarian (4.7%, a difference of 0.090%), Fijian (4.7%, a difference of 0.10%), European (4.7%, a difference of 0.12%), and Croatian (4.7%, a difference of 0.14%).
| Demographics | Rating | Rank | Female Unemployment |
| Scandinavians | 100.0 /100 | #11 | Exceptional 4.6% |
| Dutch | 100.0 /100 | #12 | Exceptional 4.6% |
| Belgians | 100.0 /100 | #13 | Exceptional 4.6% |
| Finns | 100.0 /100 | #14 | Exceptional 4.6% |
| English | 100.0 /100 | #15 | Exceptional 4.6% |
| Carpatho Rusyns | 99.9 /100 | #16 | Exceptional 4.7% |
| Croatians | 99.9 /100 | #17 | Exceptional 4.7% |
| Latvians | 99.9 /100 | #18 | Exceptional 4.7% |
| Poles | 99.9 /100 | #19 | Exceptional 4.7% |
| Bulgarians | 99.9 /100 | #20 | Exceptional 4.7% |
| Fijians | 99.9 /100 | #21 | Exceptional 4.7% |
| Europeans | 99.9 /100 | #22 | Exceptional 4.7% |
| Scottish | 99.9 /100 | #23 | Exceptional 4.7% |
| Welsh | 99.9 /100 | #24 | Exceptional 4.7% |
| Immigrants | India | 99.9 /100 | #25 | Exceptional 4.7% |