Mexican vs Pueblo Female Unemployment
COMPARE
Mexican
Pueblo
Female Unemployment
Female Unemployment Comparison
Mexicans
Pueblo
6.1%
FEMALE UNEMPLOYMENT
0.0/ 100
METRIC RATING
293rd/ 347
METRIC RANK
6.4%
FEMALE UNEMPLOYMENT
0.0/ 100
METRIC RATING
315th/ 347
METRIC RANK
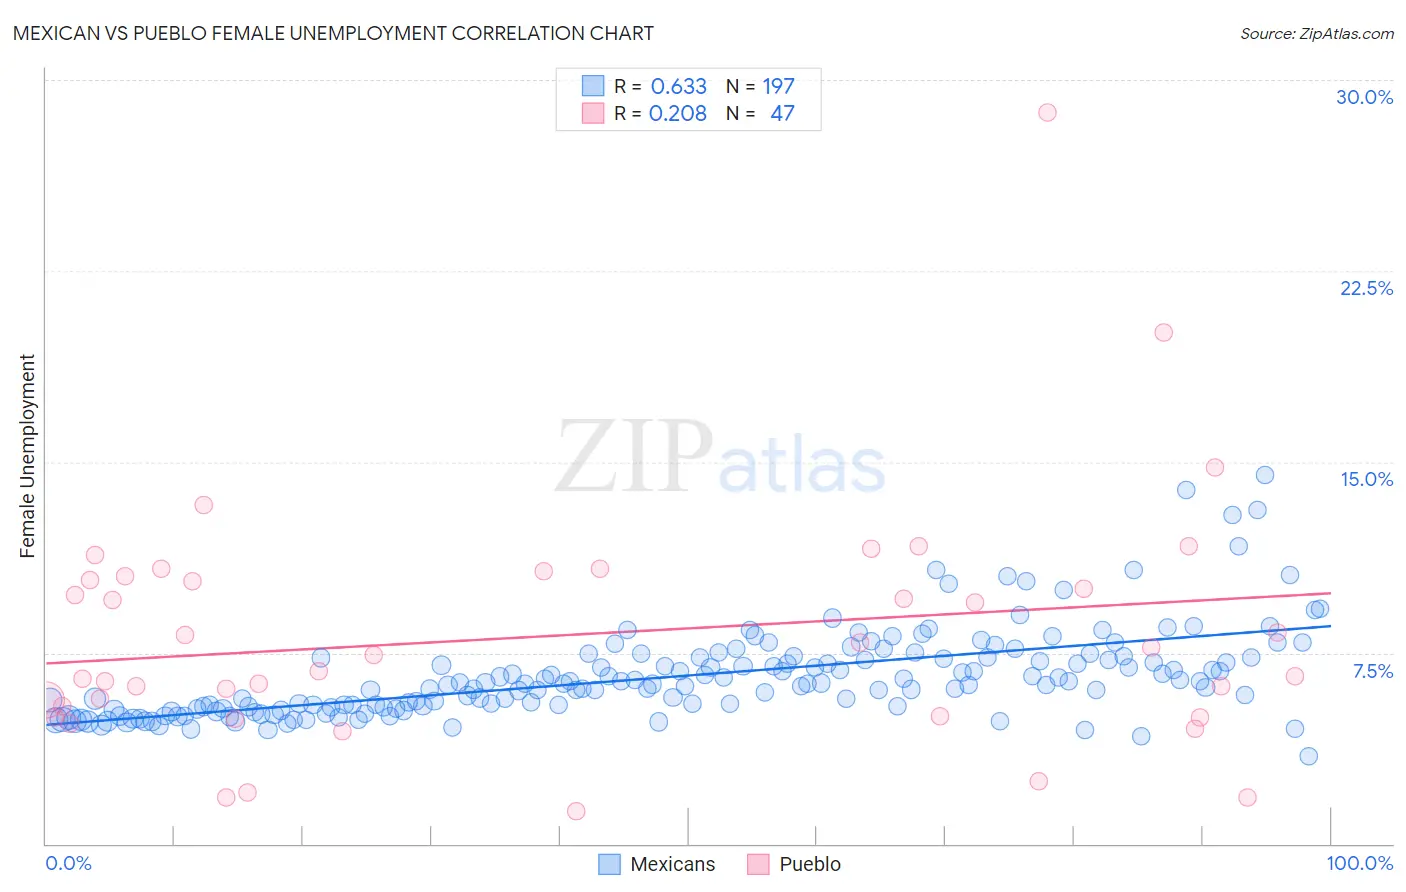
Mexican vs Pueblo Female Unemployment Correlation Chart
The statistical analysis conducted on geographies consisting of 553,339,596 people shows a significant positive correlation between the proportion of Mexicans and unemploymnet rate among females in the United States with a correlation coefficient (R) of 0.633 and weighted average of 6.1%. Similarly, the statistical analysis conducted on geographies consisting of 119,838,706 people shows a weak positive correlation between the proportion of Pueblo and unemploymnet rate among females in the United States with a correlation coefficient (R) of 0.208 and weighted average of 6.4%, a difference of 4.4%.
Female Unemployment Correlation Summary
| Measurement | Mexican | Pueblo |
| Minimum | 3.4% | 1.3% |
| Maximum | 14.5% | 28.7% |
| Range | 11.0% | 27.4% |
| Mean | 6.6% | 8.2% |
| Median | 6.3% | 7.4% |
| Interquartile 25% (IQ1) | 5.4% | 5.0% |
| Interquartile 75% (IQ3) | 7.3% | 10.5% |
| Interquartile Range (IQR) | 1.9% | 5.5% |
| Standard Deviation (Sample) | 1.8% | 4.8% |
| Standard Deviation (Population) | 1.8% | 4.7% |
Similar Demographics by Female Unemployment
Demographics Similar to Mexicans by Female Unemployment
In terms of female unemployment, the demographic groups most similar to Mexicans are Immigrants from Trinidad and Tobago (6.1%, a difference of 0.080%), Immigrants from El Salvador (6.1%, a difference of 0.10%), Immigrants from West Indies (6.1%, a difference of 0.15%), Immigrants from Latin America (6.1%, a difference of 0.20%), and Alaskan Athabascan (6.1%, a difference of 0.22%).
| Demographics | Rating | Rank | Female Unemployment |
| Chippewa | 0.0 /100 | #286 | Tragic 6.1% |
| Immigrants | Guatemala | 0.0 /100 | #287 | Tragic 6.1% |
| Haitians | 0.0 /100 | #288 | Tragic 6.1% |
| Trinidadians and Tobagonians | 0.0 /100 | #289 | Tragic 6.1% |
| Immigrants | Caribbean | 0.0 /100 | #290 | Tragic 6.1% |
| Immigrants | West Indies | 0.0 /100 | #291 | Tragic 6.1% |
| Immigrants | Trinidad and Tobago | 0.0 /100 | #292 | Tragic 6.1% |
| Mexicans | 0.0 /100 | #293 | Tragic 6.1% |
| Immigrants | El Salvador | 0.0 /100 | #294 | Tragic 6.1% |
| Immigrants | Latin America | 0.0 /100 | #295 | Tragic 6.1% |
| Alaskan Athabascans | 0.0 /100 | #296 | Tragic 6.1% |
| West Indians | 0.0 /100 | #297 | Tragic 6.1% |
| Jamaicans | 0.0 /100 | #298 | Tragic 6.1% |
| Ute | 0.0 /100 | #299 | Tragic 6.1% |
| Immigrants | Haiti | 0.0 /100 | #300 | Tragic 6.1% |
Demographics Similar to Pueblo by Female Unemployment
In terms of female unemployment, the demographic groups most similar to Pueblo are Houma (6.4%, a difference of 0.29%), Immigrants from Ecuador (6.4%, a difference of 0.31%), Belizean (6.3%, a difference of 0.54%), Immigrants from Grenada (6.3%, a difference of 0.55%), and Immigrants from St. Vincent and the Grenadines (6.4%, a difference of 0.74%).
| Demographics | Rating | Rank | Female Unemployment |
| Hispanics or Latinos | 0.0 /100 | #308 | Tragic 6.2% |
| Ecuadorians | 0.0 /100 | #309 | Tragic 6.3% |
| Central American Indians | 0.0 /100 | #310 | Tragic 6.3% |
| Immigrants | Mexico | 0.0 /100 | #311 | Tragic 6.3% |
| Immigrants | Grenada | 0.0 /100 | #312 | Tragic 6.3% |
| Belizeans | 0.0 /100 | #313 | Tragic 6.3% |
| Immigrants | Ecuador | 0.0 /100 | #314 | Tragic 6.4% |
| Pueblo | 0.0 /100 | #315 | Tragic 6.4% |
| Houma | 0.0 /100 | #316 | Tragic 6.4% |
| Immigrants | St. Vincent and the Grenadines | 0.0 /100 | #317 | Tragic 6.4% |
| British West Indians | 0.0 /100 | #318 | Tragic 6.4% |
| Immigrants | Bangladesh | 0.0 /100 | #319 | Tragic 6.5% |
| Immigrants | Dominica | 0.0 /100 | #320 | Tragic 6.5% |
| Blacks/African Americans | 0.0 /100 | #321 | Tragic 6.5% |
| Vietnamese | 0.0 /100 | #322 | Tragic 6.5% |