Menominee vs Pennsylvania German Unemployment Among Ages 20 to 24 years

COMPARE

Menominee
Race
Ancestry
AfghanAfricanAlaska NativeAlaskan AthabascanAlbanianAleutAlsatianAmericanApacheArabArapahoArgentineanArmenianAssyrian/Chaldean/SyriacAustralianAustrianBahamianBangladeshiBarbadianBasqueBelgianBelizeanBermudanBhutaneseBlackfeetBolivianBrazilianBritishBritish West IndianBulgarianBurmeseCajunCambodianCanadianCape VerdeanCarpatho RusynCelticCentral AmericanCentral American IndianCherokeeCheyenneChickasawChileanChineseChippewaChoctawColombianColvilleComancheCosta RicanCreeCreekCroatianCrowCubanCypriotCzechCzechoslovakianDanishDelawareDominicanDutchDutch West IndianEastern EuropeanEcuadorianEgyptianEnglishEstonianEthiopianEuropeanFijianFilipinoFinnishFrenchFrench American IndianFrench CanadianGermanGerman RussianGhanaianGreekGuamanian/ChamorroGuatemalanGuyaneseHaitianHmongHonduranHopiHoumaHungarianIcelanderIndian (Asian)IndonesianInupiatIranianIraqiIrishIroquoisIsraeliItalianJamaicanJapaneseJordanianKenyanKiowaKoreanLaotianLatvianLebaneseLiberianLithuanianLumbeeLuxembourgerMacedonianMalaysianMalteseMarshalleseMenomineeMexicanMexican American IndianMongolianMoroccanNative HawaiianNavajoNepaleseNew ZealanderNicaraguanNigerianNorthern EuropeanNorwegianOkinawanOsageOttawaPaiutePakistaniPalestinianPanamanianParaguayanPeruvianPimaPolishPortuguesePotawatomiPuebloPuerto RicanPuget Sound SalishRomanianRussianSalvadoranSamoanScandinavianScotch-IrishScottishSeminoleSenegaleseSerbianShoshoneSierra LeoneanSiouxSlavicSlovakSloveneSomaliSouth AfricanSouth AmericanSouth American IndianSoviet UnionSpaniardSpanishSpanish AmericanSpanish American IndianSri LankanSubsaharan AfricanSudaneseSwedishSwissSyrianTaiwaneseThaiTlingit-HaidaTohono O'OdhamTonganTrinidadian and TobagonianTsimshianTurkishU.S. Virgin IslanderUgandanUkrainianUruguayanUteVenezuelanVietnameseWelshWest IndianYakamaYaquiYugoslavianYumanYup'ikZimbabwean
Immigration
NonimmigrantsImmigrantsAfghanistanAfricaAlbaniaArgentinaArmeniaAsiaAustraliaAustriaBahamasBangladeshBarbadosBelarusBelgiumBelizeBoliviaBosnia and HerzegovinaBrazilBulgariaBurma/MyanmarCabo VerdeCambodiaCameroonCanadaCaribbeanCentral AmericaChileChinaColombiaCongoCosta RicaCroatiaCubaCzechoslovakiaDenmarkDominicaDominican RepublicEastern AfricaEastern AsiaEastern EuropeEcuadorEgyptEl SalvadorEnglandEritreaEthiopiaEuropeFijiFranceGermanyGhanaGreeceGrenadaGuatemalaGuyanaHaitiHondurasHong KongHungaryIndiaIndonesiaIranIraqIrelandIsraelItalyJamaicaJapanJordanKazakhstanKenyaKoreaKuwaitLaosLatin AmericaLatviaLebanonLiberiaLithuaniaMalaysiaMexicoMicronesiaMiddle AfricaMoldovaMoroccoNepalNetherlandsNicaraguaNigeriaNorth AmericaNorth MacedoniaNorthern AfricaNorthern EuropeNorwayOceaniaPakistanPanamaPeruPhilippinesPolandPortugalRomaniaRussiaSaudi ArabiaScotlandSenegalSerbiaSierra LeoneSingaporeSomaliaSouth AfricaSouth AmericaSouth Central AsiaSouth Eastern AsiaSouthern EuropeSpainSri LankaSt. Vincent and the GrenadinesSudanSwedenSwitzerlandSyriaTaiwanThailandTrinidad and TobagoTurkeyUgandaUkraineUruguayUzbekistanVenezuelaVietnamWest IndiesWestern AfricaWestern AsiaWestern EuropeYemenZaireZimbabweAzores
Pennsylvania German
Race
Ancestry
AfghanAfricanAlaska NativeAlaskan AthabascanAlbanianAleutAlsatianAmericanApacheArabArapahoArgentineanArmenianAssyrian/Chaldean/SyriacAustralianAustrianBahamianBangladeshiBarbadianBasqueBelgianBelizeanBermudanBhutaneseBlackfeetBolivianBrazilianBritishBritish West IndianBulgarianBurmeseCajunCambodianCanadianCape VerdeanCarpatho RusynCelticCentral AmericanCentral American IndianCherokeeCheyenneChickasawChileanChineseChippewaChoctawColombianColvilleComancheCosta RicanCreeCreekCroatianCrowCubanCypriotCzechCzechoslovakianDanishDelawareDominicanDutchDutch West IndianEastern EuropeanEcuadorianEgyptianEnglishEstonianEthiopianEuropeanFijianFilipinoFinnishFrenchFrench American IndianFrench CanadianGermanGerman RussianGhanaianGreekGuamanian/ChamorroGuatemalanGuyaneseHaitianHmongHonduranHopiHoumaHungarianIcelanderIndian (Asian)IndonesianInupiatIranianIraqiIrishIroquoisIsraeliItalianJamaicanJapaneseJordanianKenyanKiowaKoreanLaotianLatvianLebaneseLiberianLithuanianLumbeeLuxembourgerMacedonianMalaysianMalteseMarshalleseMexicanMexican American IndianMongolianMoroccanNative HawaiianNavajoNepaleseNew ZealanderNicaraguanNigerianNorthern EuropeanNorwegianOkinawanOsageOttawaPaiutePakistaniPalestinianPanamanianParaguayanPennsylvania GermanPeruvianPimaPolishPortuguesePotawatomiPuebloPuerto RicanPuget Sound SalishRomanianRussianSalvadoranSamoanScandinavianScotch-IrishScottishSeminoleSenegaleseSerbianShoshoneSierra LeoneanSiouxSlavicSlovakSloveneSomaliSouth AfricanSouth AmericanSouth American IndianSoviet UnionSpaniardSpanishSpanish AmericanSpanish American IndianSri LankanSubsaharan AfricanSudaneseSwedishSwissSyrianTaiwaneseThaiTlingit-HaidaTohono O'OdhamTonganTrinidadian and TobagonianTsimshianTurkishU.S. Virgin IslanderUgandanUkrainianUruguayanUteVenezuelanVietnameseWelshWest IndianYakamaYaquiYugoslavianYumanYup'ikZimbabwean
Immigration
NonimmigrantsImmigrantsAfghanistanAfricaAlbaniaArgentinaArmeniaAsiaAustraliaAustriaBahamasBangladeshBarbadosBelarusBelgiumBelizeBoliviaBosnia and HerzegovinaBrazilBulgariaBurma/MyanmarCabo VerdeCambodiaCameroonCanadaCaribbeanCentral AmericaChileChinaColombiaCongoCosta RicaCroatiaCubaCzechoslovakiaDenmarkDominicaDominican RepublicEastern AfricaEastern AsiaEastern EuropeEcuadorEgyptEl SalvadorEnglandEritreaEthiopiaEuropeFijiFranceGermanyGhanaGreeceGrenadaGuatemalaGuyanaHaitiHondurasHong KongHungaryIndiaIndonesiaIranIraqIrelandIsraelItalyJamaicaJapanJordanKazakhstanKenyaKoreaKuwaitLaosLatin AmericaLatviaLebanonLiberiaLithuaniaMalaysiaMexicoMicronesiaMiddle AfricaMoldovaMoroccoNepalNetherlandsNicaraguaNigeriaNorth AmericaNorth MacedoniaNorthern AfricaNorthern EuropeNorwayOceaniaPakistanPanamaPeruPhilippinesPolandPortugalRomaniaRussiaSaudi ArabiaScotlandSenegalSerbiaSierra LeoneSingaporeSomaliaSouth AfricaSouth AmericaSouth Central AsiaSouth Eastern AsiaSouthern EuropeSpainSri LankaSt. Vincent and the GrenadinesSudanSwedenSwitzerlandSyriaTaiwanThailandTrinidad and TobagoTurkeyUgandaUkraineUruguayUzbekistanVenezuelaVietnamWest IndiesWestern AfricaWestern AsiaWestern EuropeYemenZaireZimbabweAzores
Unemployment Among Ages 20 to 24 years
Income
Poverty
Unemployment
Labor Participation
Family Structure
Vehicle Availability
Education Level
Disability

Unemployment Among Ages 20 to 24 years Comparison

Menominee

Pennsylvania Germans

Exceptional
Exceptional
9.7%
UNEMPLOYMENT AMONG AGES 20 TO 24 YEARS
99.8/ 100
METRIC RATING
43rd/ 347
METRIC RANK
10.0%
UNEMPLOYMENT AMONG AGES 20 TO 24 YEARS
93.9/ 100
METRIC RATING
106th/ 347
METRIC RANK

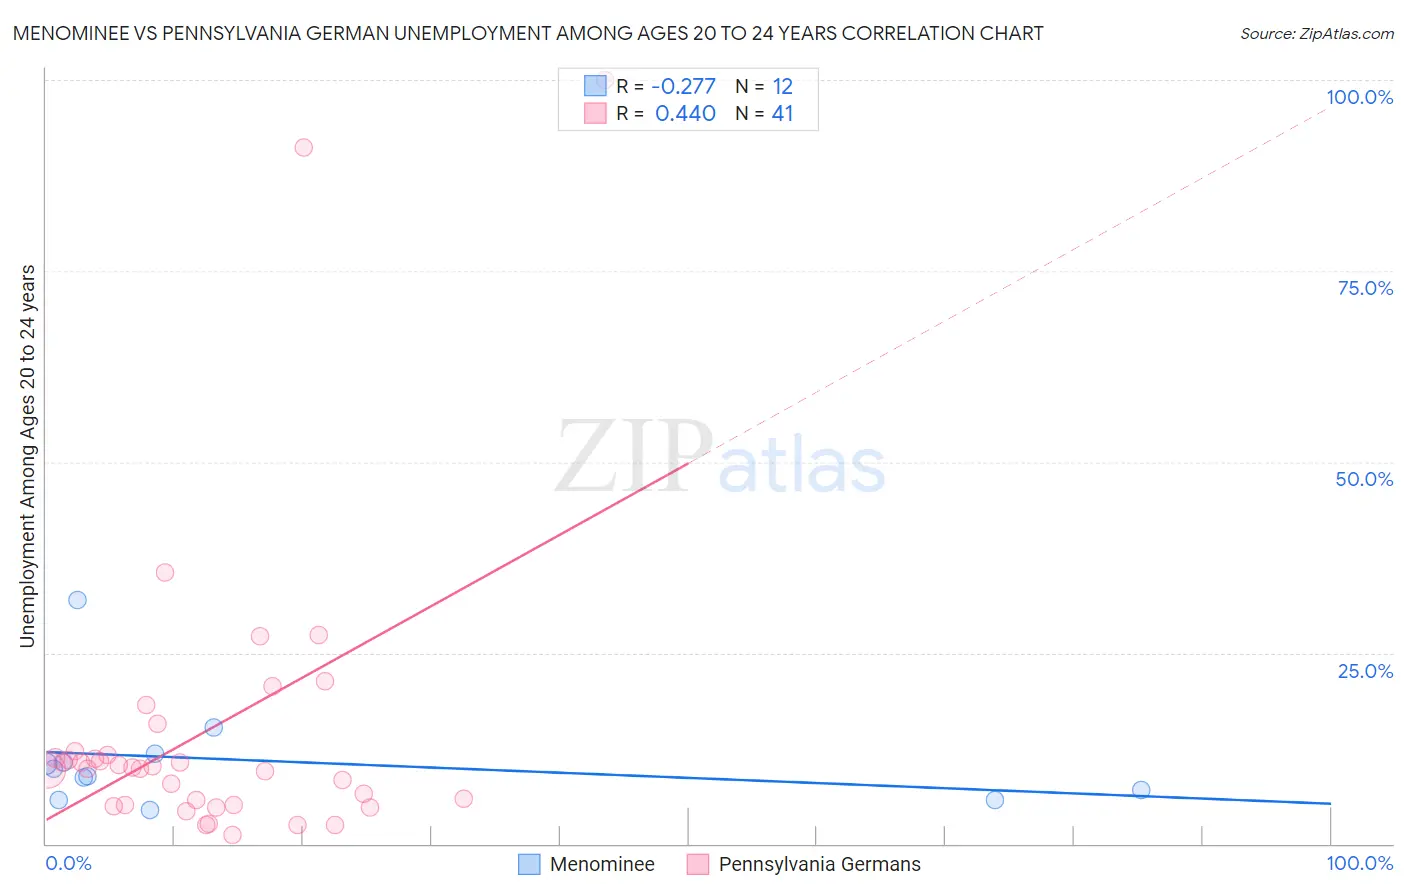
Menominee vs Pennsylvania German Unemployment Among Ages 20 to 24 years Correlation Chart

The statistical analysis conducted on geographies consisting of 45,217,479 people shows a weak negative correlation between the proportion of Menominee and unemployment rate among population between the ages 20 and 24 in the United States with a correlation coefficient (R) of -0.277 and weighted average of 9.7%. Similarly, the statistical analysis conducted on geographies consisting of 225,394,343 people shows a moderate positive correlation between the proportion of Pennsylvania Germans and unemployment rate among population between the ages 20 and 24 in the United States with a correlation coefficient (R) of 0.440 and weighted average of 10.0%, a difference of 3.7%.
Menominee vs Pennsylvania German Unemployment Among Ages 20 to 24 years

Unemployment Among Ages 20 to 24 years Correlation Summary

MeasurementMenomineePennsylvania German
Minimum4.5%1.1%
Maximum32.0%100.0%
Range27.5%98.9%
Mean10.9%14.6%
Median9.3%10.0%
Interquartile 25% (IQ1)6.4%5.1%
Interquartile 75% (IQ3)11.3%11.8%
Interquartile Range (IQR)4.8%6.7%
Standard Deviation (Sample)7.3%20.0%
Standard Deviation (Population)7.0%19.7%

Similar Demographics by Unemployment Among Ages 20 to 24 years

Demographics Similar to Menominee by Unemployment Among Ages 20 to 24 years

In terms of unemployment among ages 20 to 24 years, the demographic groups most similar to Menominee are European (9.7%, a difference of 0.13%), Immigrants from Saudi Arabia (9.7%, a difference of 0.16%), Croatian (9.7%, a difference of 0.19%), Immigrants from Nicaragua (9.7%, a difference of 0.20%), and Swiss (9.7%, a difference of 0.24%).
DemographicsRating | RankUnemployment Among Ages 20 to 24 years
Belgians
100.0
/100
|
#36
Exceptional
9.6%
Immigrants | Zaire
100.0
/100
|
#37
Exceptional
9.6%
Afghans
99.9
/100
|
#38
Exceptional
9.6%
Dutch
99.9
/100
|
#39
Exceptional
9.6%
Immigrants | Ethiopia
99.9
/100
|
#40
Exceptional
9.6%
Swiss
99.9
/100
|
#41
Exceptional
9.7%
Immigrants | Saudi Arabia
99.9
/100
|
#42
Exceptional
9.7%
Menominee
99.8
/100
|
#43
Exceptional
9.7%
Europeans
99.8
/100
|
#44
Exceptional
9.7%
Croatians
99.8
/100
|
#45
Exceptional
9.7%
Immigrants | Nicaragua
99.8
/100
|
#46
Exceptional
9.7%
Immigrants | India
99.8
/100
|
#47
Exceptional
9.7%
Finns
99.8
/100
|
#48
Exceptional
9.7%
Creek
99.8
/100
|
#49
Exceptional
9.7%
Immigrants | Kenya
99.7
/100
|
#50
Exceptional
9.7%

Demographics Similar to Pennsylvania Germans by Unemployment Among Ages 20 to 24 years

In terms of unemployment among ages 20 to 24 years, the demographic groups most similar to Pennsylvania Germans are Immigrants from Hungary (10.0%, a difference of 0.020%), Immigrants from Chile (10.0%, a difference of 0.030%), Irish (10.0%, a difference of 0.070%), Iroquois (10.1%, a difference of 0.070%), and Immigrants from Latvia (10.1%, a difference of 0.10%).
DemographicsRating | RankUnemployment Among Ages 20 to 24 years
Fijians
95.3
/100
|
#99
Exceptional
10.0%
Immigrants | France
95.2
/100
|
#100
Exceptional
10.0%
Laotians
95.1
/100
|
#101
Exceptional
10.0%
Immigrants | Argentina
94.9
/100
|
#102
Exceptional
10.0%
Irish
94.3
/100
|
#103
Exceptional
10.0%
Immigrants | Chile
94.0
/100
|
#104
Exceptional
10.0%
Immigrants | Hungary
94.0
/100
|
#105
Exceptional
10.0%
Pennsylvania Germans
93.9
/100
|
#106
Exceptional
10.0%
Iroquois
93.4
/100
|
#107
Exceptional
10.1%
Immigrants | Latvia
93.2
/100
|
#108
Exceptional
10.1%
Filipinos
93.2
/100
|
#109
Exceptional
10.1%
Immigrants | Spain
93.1
/100
|
#110
Exceptional
10.1%
Immigrants | Indonesia
92.7
/100
|
#111
Exceptional
10.1%
Northern Europeans
92.7
/100
|
#112
Exceptional
10.1%
German Russians
92.4
/100
|
#113
Exceptional
10.1%