Immigrants from Africa vs Pennsylvania German Unemployment Among Ages 20 to 24 years
COMPARE
Immigrants from Africa
Pennsylvania German
Unemployment Among Ages 20 to 24 years
Unemployment Among Ages 20 to 24 years Comparison
Immigrants from Africa
Pennsylvania Germans
10.6%
UNEMPLOYMENT AMONG AGES 20 TO 24 YEARS
3.5/ 100
METRIC RATING
234th/ 347
METRIC RANK
10.0%
UNEMPLOYMENT AMONG AGES 20 TO 24 YEARS
93.9/ 100
METRIC RATING
106th/ 347
METRIC RANK
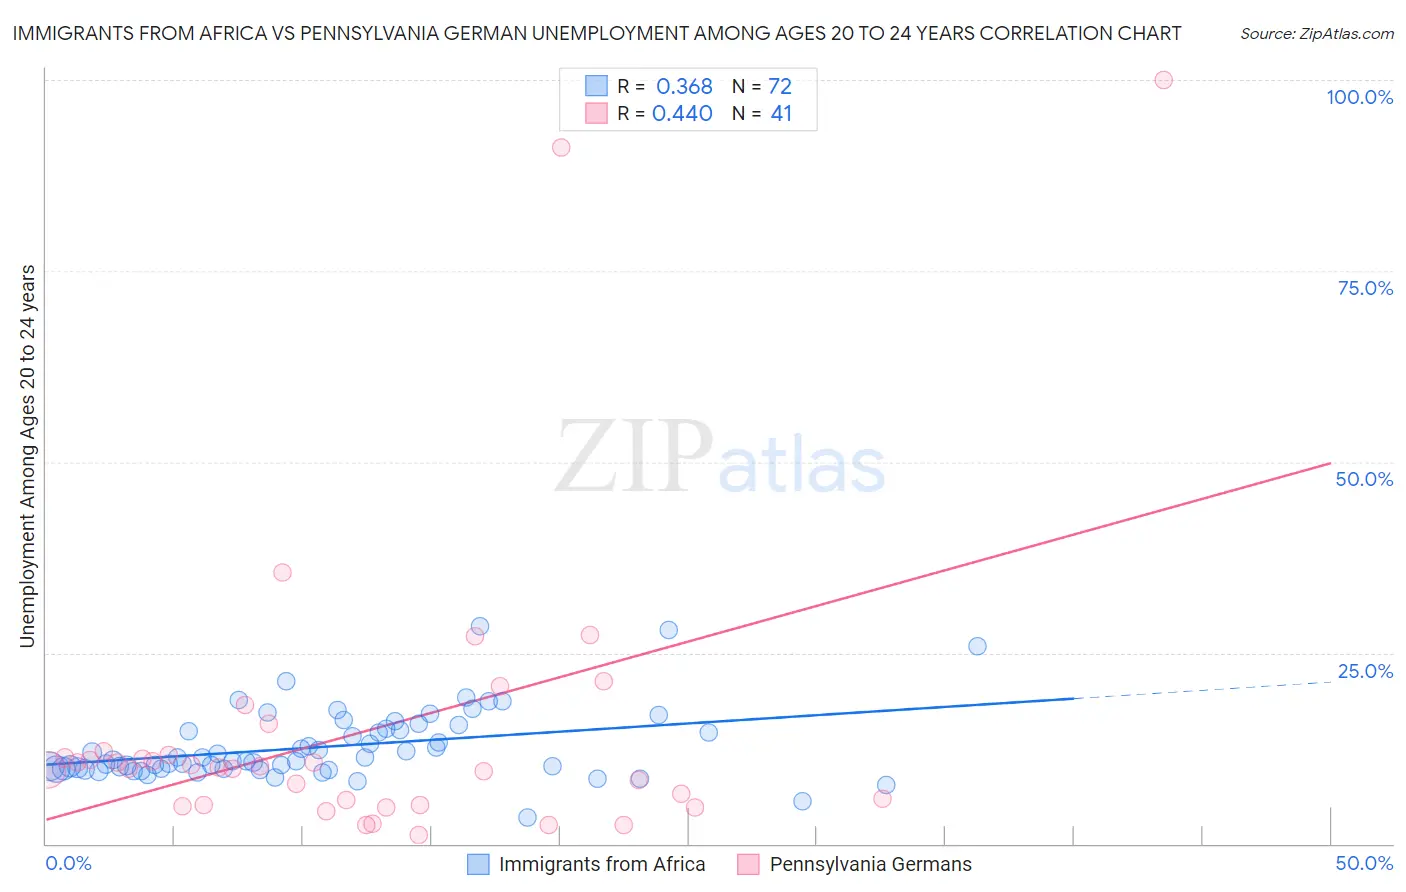
Immigrants from Africa vs Pennsylvania German Unemployment Among Ages 20 to 24 years Correlation Chart
The statistical analysis conducted on geographies consisting of 452,366,731 people shows a mild positive correlation between the proportion of Immigrants from Africa and unemployment rate among population between the ages 20 and 24 in the United States with a correlation coefficient (R) of 0.368 and weighted average of 10.6%. Similarly, the statistical analysis conducted on geographies consisting of 225,394,343 people shows a moderate positive correlation between the proportion of Pennsylvania Germans and unemployment rate among population between the ages 20 and 24 in the United States with a correlation coefficient (R) of 0.440 and weighted average of 10.0%, a difference of 5.7%.
Unemployment Among Ages 20 to 24 years Correlation Summary
| Measurement | Immigrants from Africa | Pennsylvania German |
| Minimum | 3.5% | 1.1% |
| Maximum | 28.4% | 100.0% |
| Range | 24.9% | 98.9% |
| Mean | 12.7% | 14.6% |
| Median | 10.9% | 10.0% |
| Interquartile 25% (IQ1) | 9.8% | 5.1% |
| Interquartile 75% (IQ3) | 15.0% | 11.8% |
| Interquartile Range (IQR) | 5.2% | 6.7% |
| Standard Deviation (Sample) | 4.6% | 20.0% |
| Standard Deviation (Population) | 4.6% | 19.7% |
Similar Demographics by Unemployment Among Ages 20 to 24 years
Demographics Similar to Immigrants from Africa by Unemployment Among Ages 20 to 24 years
In terms of unemployment among ages 20 to 24 years, the demographic groups most similar to Immigrants from Africa are Choctaw (10.6%, a difference of 0.010%), Israeli (10.6%, a difference of 0.040%), Immigrants from Ukraine (10.6%, a difference of 0.050%), Native Hawaiian (10.6%, a difference of 0.090%), and Mexican (10.6%, a difference of 0.090%).
| Demographics | Rating | Rank | Unemployment Among Ages 20 to 24 years |
| Palestinians | 4.9 /100 | #227 | Tragic 10.6% |
| Mexican American Indians | 4.6 /100 | #228 | Tragic 10.6% |
| Americans | 4.4 /100 | #229 | Tragic 10.6% |
| French American Indians | 4.1 /100 | #230 | Tragic 10.6% |
| Native Hawaiians | 3.9 /100 | #231 | Tragic 10.6% |
| Israelis | 3.7 /100 | #232 | Tragic 10.6% |
| Choctaw | 3.6 /100 | #233 | Tragic 10.6% |
| Immigrants | Africa | 3.5 /100 | #234 | Tragic 10.6% |
| Immigrants | Ukraine | 3.3 /100 | #235 | Tragic 10.6% |
| Mexicans | 3.2 /100 | #236 | Tragic 10.6% |
| Immigrants | Immigrants | 2.7 /100 | #237 | Tragic 10.6% |
| Immigrants | Pakistan | 2.6 /100 | #238 | Tragic 10.6% |
| Salvadorans | 2.4 /100 | #239 | Tragic 10.7% |
| Immigrants | Central America | 2.0 /100 | #240 | Tragic 10.7% |
| Immigrants | El Salvador | 1.7 /100 | #241 | Tragic 10.7% |
Demographics Similar to Pennsylvania Germans by Unemployment Among Ages 20 to 24 years
In terms of unemployment among ages 20 to 24 years, the demographic groups most similar to Pennsylvania Germans are Immigrants from Hungary (10.0%, a difference of 0.020%), Immigrants from Chile (10.0%, a difference of 0.030%), Irish (10.0%, a difference of 0.070%), Iroquois (10.1%, a difference of 0.070%), and Immigrants from Latvia (10.1%, a difference of 0.10%).
| Demographics | Rating | Rank | Unemployment Among Ages 20 to 24 years |
| Fijians | 95.3 /100 | #99 | Exceptional 10.0% |
| Immigrants | France | 95.2 /100 | #100 | Exceptional 10.0% |
| Laotians | 95.1 /100 | #101 | Exceptional 10.0% |
| Immigrants | Argentina | 94.9 /100 | #102 | Exceptional 10.0% |
| Irish | 94.3 /100 | #103 | Exceptional 10.0% |
| Immigrants | Chile | 94.0 /100 | #104 | Exceptional 10.0% |
| Immigrants | Hungary | 94.0 /100 | #105 | Exceptional 10.0% |
| Pennsylvania Germans | 93.9 /100 | #106 | Exceptional 10.0% |
| Iroquois | 93.4 /100 | #107 | Exceptional 10.1% |
| Immigrants | Latvia | 93.2 /100 | #108 | Exceptional 10.1% |
| Filipinos | 93.2 /100 | #109 | Exceptional 10.1% |
| Immigrants | Spain | 93.1 /100 | #110 | Exceptional 10.1% |
| Immigrants | Indonesia | 92.7 /100 | #111 | Exceptional 10.1% |
| Northern Europeans | 92.7 /100 | #112 | Exceptional 10.1% |
| German Russians | 92.4 /100 | #113 | Exceptional 10.1% |