Maltese vs Ghanaian Unemployment Among Ages 35 to 44 years

COMPARE

Maltese
Race
Ancestry
AfghanAfricanAlaska NativeAlaskan AthabascanAlbanianAleutAlsatianAmericanApacheArabArapahoArgentineanArmenianAssyrian/Chaldean/SyriacAustralianAustrianBahamianBangladeshiBarbadianBasqueBelgianBelizeanBermudanBhutaneseBlackfeetBolivianBrazilianBritishBritish West IndianBulgarianBurmeseCajunCambodianCanadianCape VerdeanCarpatho RusynCelticCentral AmericanCentral American IndianCherokeeCheyenneChickasawChileanChineseChippewaChoctawColombianColvilleComancheCosta RicanCreeCreekCroatianCrowCubanCypriotCzechCzechoslovakianDanishDelawareDominicanDutchDutch West IndianEastern EuropeanEcuadorianEgyptianEnglishEstonianEthiopianEuropeanFijianFilipinoFinnishFrenchFrench American IndianFrench CanadianGermanGerman RussianGreekGuamanian/ChamorroGuatemalanGuyaneseHaitianHmongHonduranHopiHoumaHungarianIcelanderIndian (Asian)IndonesianInupiatIranianIraqiIrishIroquoisIsraeliItalianJamaicanJapaneseJordanianKenyanKiowaKoreanLaotianLatvianLebaneseLiberianLithuanianLumbeeLuxembourgerMacedonianMalaysianMalteseMarshalleseMenomineeMexicanMexican American IndianMongolianMoroccanNative HawaiianNavajoNepaleseNew ZealanderNicaraguanNigerianNorthern EuropeanNorwegianOkinawanOsageOttawaPaiutePakistaniPalestinianPanamanianParaguayanPennsylvania GermanPeruvianPimaPolishPortuguesePotawatomiPuebloPuerto RicanPuget Sound SalishRomanianRussianSalvadoranSamoanScandinavianScotch-IrishScottishSeminoleSenegaleseSerbianShoshoneSierra LeoneanSiouxSlavicSlovakSloveneSomaliSouth AfricanSouth AmericanSouth American IndianSoviet UnionSpaniardSpanishSpanish AmericanSpanish American IndianSri LankanSubsaharan AfricanSudaneseSwedishSwissSyrianTaiwaneseThaiTlingit-HaidaTohono O'OdhamTonganTrinidadian and TobagonianTsimshianTurkishU.S. Virgin IslanderUgandanUkrainianUruguayanUteVenezuelanVietnameseWelshWest IndianYakamaYaquiYugoslavianYumanYup'ikZimbabwean
Immigration
NonimmigrantsImmigrantsAfghanistanAfricaAlbaniaArgentinaArmeniaAsiaAustraliaAustriaBahamasBangladeshBarbadosBelarusBelgiumBelizeBoliviaBosnia and HerzegovinaBrazilBulgariaBurma/MyanmarCabo VerdeCambodiaCameroonCanadaCaribbeanCentral AmericaChileChinaColombiaCongoCosta RicaCroatiaCubaCzechoslovakiaDenmarkDominicaDominican RepublicEastern AfricaEastern AsiaEastern EuropeEcuadorEgyptEl SalvadorEnglandEritreaEthiopiaEuropeFijiFranceGermanyGhanaGreeceGrenadaGuatemalaGuyanaHaitiHondurasHong KongHungaryIndiaIndonesiaIranIraqIrelandIsraelItalyJamaicaJapanJordanKazakhstanKenyaKoreaKuwaitLaosLatin AmericaLatviaLebanonLiberiaLithuaniaMalaysiaMexicoMicronesiaMiddle AfricaMoldovaMoroccoNepalNetherlandsNicaraguaNigeriaNorth AmericaNorth MacedoniaNorthern AfricaNorthern EuropeNorwayOceaniaPakistanPanamaPeruPhilippinesPolandPortugalRomaniaRussiaSaudi ArabiaScotlandSenegalSerbiaSierra LeoneSingaporeSomaliaSouth AfricaSouth AmericaSouth Central AsiaSouth Eastern AsiaSouthern EuropeSpainSri LankaSt. Vincent and the GrenadinesSudanSwedenSwitzerlandSyriaTaiwanThailandTrinidad and TobagoTurkeyUgandaUkraineUruguayUzbekistanVenezuelaVietnamWest IndiesWestern AfricaWestern AsiaWestern EuropeYemenZaireZimbabweAzores
Ghanaian
Race
Ancestry
AfghanAfricanAlaska NativeAlaskan AthabascanAlbanianAleutAlsatianAmericanApacheArabArapahoArgentineanArmenianAssyrian/Chaldean/SyriacAustralianAustrianBahamianBangladeshiBarbadianBasqueBelgianBelizeanBermudanBhutaneseBlackfeetBolivianBrazilianBritishBritish West IndianBulgarianBurmeseCajunCambodianCanadianCape VerdeanCarpatho RusynCelticCentral AmericanCentral American IndianCherokeeCheyenneChickasawChileanChineseChippewaChoctawColombianColvilleComancheCosta RicanCreeCreekCroatianCrowCubanCypriotCzechCzechoslovakianDanishDelawareDominicanDutchDutch West IndianEastern EuropeanEcuadorianEgyptianEnglishEstonianEthiopianEuropeanFijianFilipinoFinnishFrenchFrench American IndianFrench CanadianGermanGerman RussianGhanaianGreekGuamanian/ChamorroGuatemalanGuyaneseHaitianHmongHonduranHopiHoumaHungarianIcelanderIndian (Asian)IndonesianInupiatIranianIraqiIrishIroquoisIsraeliItalianJamaicanJapaneseJordanianKenyanKiowaKoreanLaotianLatvianLebaneseLiberianLithuanianLumbeeLuxembourgerMacedonianMalaysianMarshalleseMenomineeMexicanMexican American IndianMongolianMoroccanNative HawaiianNavajoNepaleseNew ZealanderNicaraguanNigerianNorthern EuropeanNorwegianOkinawanOsageOttawaPaiutePakistaniPalestinianPanamanianParaguayanPennsylvania GermanPeruvianPimaPolishPortuguesePotawatomiPuebloPuerto RicanPuget Sound SalishRomanianRussianSalvadoranSamoanScandinavianScotch-IrishScottishSeminoleSenegaleseSerbianShoshoneSierra LeoneanSiouxSlavicSlovakSloveneSomaliSouth AfricanSouth AmericanSouth American IndianSoviet UnionSpaniardSpanishSpanish AmericanSpanish American IndianSri LankanSubsaharan AfricanSudaneseSwedishSwissSyrianTaiwaneseThaiTlingit-HaidaTohono O'OdhamTonganTrinidadian and TobagonianTsimshianTurkishU.S. Virgin IslanderUgandanUkrainianUruguayanUteVenezuelanVietnameseWelshWest IndianYakamaYaquiYugoslavianYumanYup'ikZimbabwean
Immigration
NonimmigrantsImmigrantsAfghanistanAfricaAlbaniaArgentinaArmeniaAsiaAustraliaAustriaBahamasBangladeshBarbadosBelarusBelgiumBelizeBoliviaBosnia and HerzegovinaBrazilBulgariaBurma/MyanmarCabo VerdeCambodiaCameroonCanadaCaribbeanCentral AmericaChileChinaColombiaCongoCosta RicaCroatiaCubaCzechoslovakiaDenmarkDominicaDominican RepublicEastern AfricaEastern AsiaEastern EuropeEcuadorEgyptEl SalvadorEnglandEritreaEthiopiaEuropeFijiFranceGermanyGhanaGreeceGrenadaGuatemalaGuyanaHaitiHondurasHong KongHungaryIndiaIndonesiaIranIraqIrelandIsraelItalyJamaicaJapanJordanKazakhstanKenyaKoreaKuwaitLaosLatin AmericaLatviaLebanonLiberiaLithuaniaMalaysiaMexicoMicronesiaMiddle AfricaMoldovaMoroccoNepalNetherlandsNicaraguaNigeriaNorth AmericaNorth MacedoniaNorthern AfricaNorthern EuropeNorwayOceaniaPakistanPanamaPeruPhilippinesPolandPortugalRomaniaRussiaSaudi ArabiaScotlandSenegalSerbiaSierra LeoneSingaporeSomaliaSouth AfricaSouth AmericaSouth Central AsiaSouth Eastern AsiaSouthern EuropeSpainSri LankaSt. Vincent and the GrenadinesSudanSwedenSwitzerlandSyriaTaiwanThailandTrinidad and TobagoTurkeyUgandaUkraineUruguayUzbekistanVenezuelaVietnamWest IndiesWestern AfricaWestern AsiaWestern EuropeYemenZaireZimbabweAzores
Unemployment Among Ages 35 to 44 years
Income
Poverty
Unemployment
Labor Participation
Family Structure
Vehicle Availability
Education Level
Disability

Unemployment Among Ages 35 to 44 years Comparison

Maltese

Ghanaians

Excellent
Tragic
4.5%
UNEMPLOYMENT AMONG AGES 35 TO 44 YEARS
88.1/ 100
METRIC RATING
115th/ 347
METRIC RANK
5.3%
UNEMPLOYMENT AMONG AGES 35 TO 44 YEARS
0.1/ 100
METRIC RATING
264th/ 347
METRIC RANK

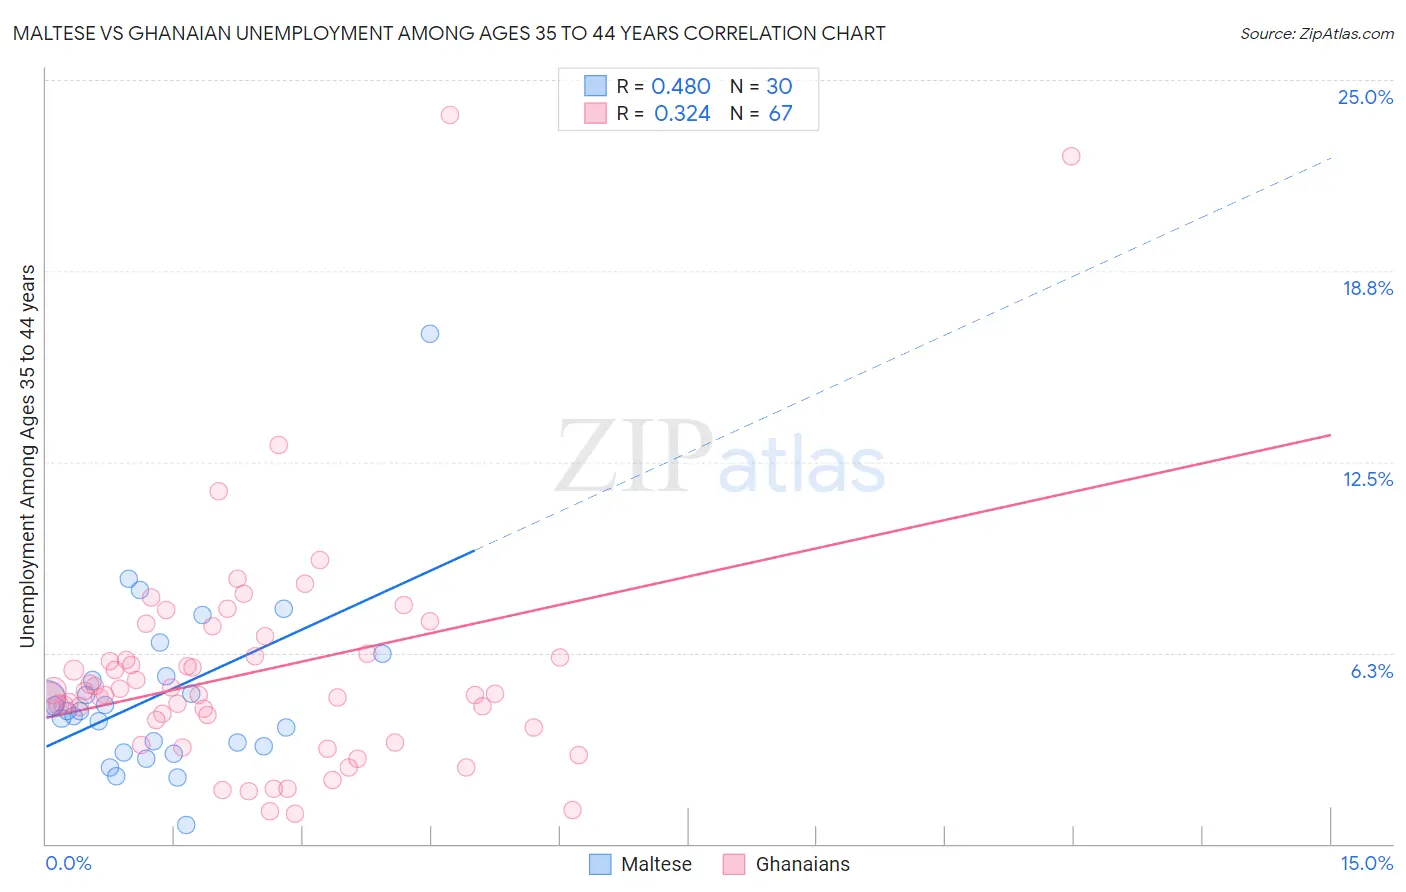
Maltese vs Ghanaian Unemployment Among Ages 35 to 44 years Correlation Chart

The statistical analysis conducted on geographies consisting of 125,326,495 people shows a moderate positive correlation between the proportion of Maltese and unemployment rate among population between the ages 35 and 44 in the United States with a correlation coefficient (R) of 0.480 and weighted average of 4.5%. Similarly, the statistical analysis conducted on geographies consisting of 189,159,357 people shows a mild positive correlation between the proportion of Ghanaians and unemployment rate among population between the ages 35 and 44 in the United States with a correlation coefficient (R) of 0.324 and weighted average of 5.3%, a difference of 17.3%.
Maltese vs Ghanaian Unemployment Among Ages 35 to 44 years

Unemployment Among Ages 35 to 44 years Correlation Summary

MeasurementMalteseGhanaian
Minimum0.60%1.0%
Maximum16.7%23.9%
Range16.1%22.9%
Mean4.9%5.6%
Median4.3%4.9%
Interquartile 25% (IQ1)3.2%3.8%
Interquartile 75% (IQ3)5.5%6.2%
Interquartile Range (IQR)2.3%2.4%
Standard Deviation (Sample)2.9%3.9%
Standard Deviation (Population)2.9%3.8%

Similar Demographics by Unemployment Among Ages 35 to 44 years

Demographics Similar to Maltese by Unemployment Among Ages 35 to 44 years

In terms of unemployment among ages 35 to 44 years, the demographic groups most similar to Maltese are Immigrants from Israel (4.5%, a difference of 0.010%), Macedonian (4.5%, a difference of 0.030%), Immigrants from Greece (4.5%, a difference of 0.030%), Irish (4.5%, a difference of 0.040%), and Immigrants from Italy (4.5%, a difference of 0.050%).
DemographicsRating | RankUnemployment Among Ages 35 to 44 years
New Zealanders
90.3
/100
|
#108
Exceptional
4.5%
Romanians
90.3
/100
|
#109
Exceptional
4.5%
Immigrants | Kazakhstan
90.0
/100
|
#110
Excellent
4.5%
Immigrants | Nicaragua
89.8
/100
|
#111
Excellent
4.5%
Immigrants | Czechoslovakia
89.2
/100
|
#112
Excellent
4.5%
Immigrants | Italy
88.4
/100
|
#113
Excellent
4.5%
Macedonians
88.3
/100
|
#114
Excellent
4.5%
Maltese
88.1
/100
|
#115
Excellent
4.5%
Immigrants | Israel
88.1
/100
|
#116
Excellent
4.5%
Immigrants | Greece
87.9
/100
|
#117
Excellent
4.5%
Irish
87.9
/100
|
#118
Excellent
4.5%
Nicaraguans
87.6
/100
|
#119
Excellent
4.5%
Ethiopians
87.1
/100
|
#120
Excellent
4.5%
Immigrants | South Africa
86.8
/100
|
#121
Excellent
4.5%
Sri Lankans
86.8
/100
|
#122
Excellent
4.5%

Demographics Similar to Ghanaians by Unemployment Among Ages 35 to 44 years

In terms of unemployment among ages 35 to 44 years, the demographic groups most similar to Ghanaians are Choctaw (5.3%, a difference of 0.0%), Immigrants from Central America (5.3%, a difference of 0.070%), Yaqui (5.3%, a difference of 0.19%), Immigrants from Bangladesh (5.3%, a difference of 0.21%), and Immigrants from Western Africa (5.3%, a difference of 0.34%).
DemographicsRating | RankUnemployment Among Ages 35 to 44 years
Immigrants | Fiji
0.1
/100
|
#257
Tragic
5.3%
Immigrants | Latin America
0.1
/100
|
#258
Tragic
5.3%
Mexicans
0.1
/100
|
#259
Tragic
5.3%
Sub-Saharan Africans
0.1
/100
|
#260
Tragic
5.3%
Spanish Americans
0.1
/100
|
#261
Tragic
5.3%
Immigrants | Central America
0.1
/100
|
#262
Tragic
5.3%
Choctaw
0.1
/100
|
#263
Tragic
5.3%
Ghanaians
0.1
/100
|
#264
Tragic
5.3%
Yaqui
0.1
/100
|
#265
Tragic
5.3%
Immigrants | Bangladesh
0.1
/100
|
#266
Tragic
5.3%
Immigrants | Western Africa
0.0
/100
|
#267
Tragic
5.3%
Hawaiians
0.0
/100
|
#268
Tragic
5.3%
Cajuns
0.0
/100
|
#269
Tragic
5.3%
Blackfeet
0.0
/100
|
#270
Tragic
5.3%
Ute
0.0
/100
|
#271
Tragic
5.3%