Hispanic or Latino vs Ghanaian Unemployment Among Ages 35 to 44 years
COMPARE
Hispanic or Latino
Ghanaian
Unemployment Among Ages 35 to 44 years
Unemployment Among Ages 35 to 44 years Comparison
Hispanics or Latinos
Ghanaians
5.5%
UNEMPLOYMENT AMONG AGES 35 TO 44 YEARS
0.0/ 100
METRIC RATING
285th/ 347
METRIC RANK
5.3%
UNEMPLOYMENT AMONG AGES 35 TO 44 YEARS
0.1/ 100
METRIC RATING
264th/ 347
METRIC RANK
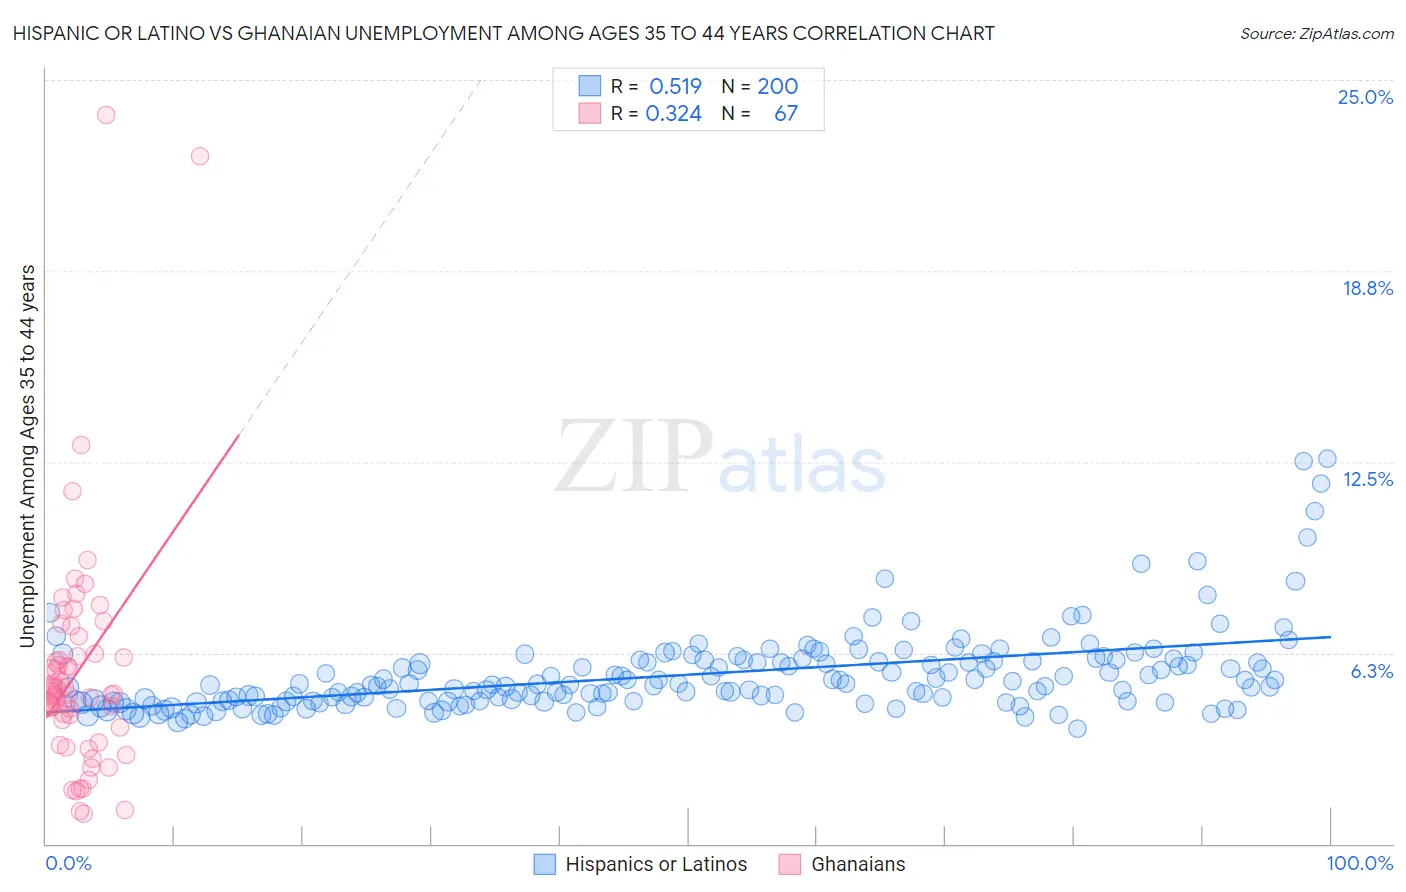
Hispanic or Latino vs Ghanaian Unemployment Among Ages 35 to 44 years Correlation Chart
The statistical analysis conducted on geographies consisting of 537,806,925 people shows a substantial positive correlation between the proportion of Hispanics or Latinos and unemployment rate among population between the ages 35 and 44 in the United States with a correlation coefficient (R) of 0.519 and weighted average of 5.5%. Similarly, the statistical analysis conducted on geographies consisting of 189,159,357 people shows a mild positive correlation between the proportion of Ghanaians and unemployment rate among population between the ages 35 and 44 in the United States with a correlation coefficient (R) of 0.324 and weighted average of 5.3%, a difference of 3.4%.
Unemployment Among Ages 35 to 44 years Correlation Summary
| Measurement | Hispanic or Latino | Ghanaian |
| Minimum | 3.8% | 1.0% |
| Maximum | 12.6% | 23.9% |
| Range | 8.8% | 22.9% |
| Mean | 5.5% | 5.6% |
| Median | 5.2% | 4.9% |
| Interquartile 25% (IQ1) | 4.7% | 3.8% |
| Interquartile 75% (IQ3) | 6.0% | 6.2% |
| Interquartile Range (IQR) | 1.3% | 2.4% |
| Standard Deviation (Sample) | 1.4% | 3.9% |
| Standard Deviation (Population) | 1.4% | 3.8% |
Similar Demographics by Unemployment Among Ages 35 to 44 years
Demographics Similar to Hispanics or Latinos by Unemployment Among Ages 35 to 44 years
In terms of unemployment among ages 35 to 44 years, the demographic groups most similar to Hispanics or Latinos are Immigrants from Micronesia (5.5%, a difference of 0.12%), Haitian (5.5%, a difference of 0.16%), French American Indian (5.5%, a difference of 0.24%), Cree (5.5%, a difference of 0.40%), and Immigrants from Ecuador (5.4%, a difference of 0.70%).
| Demographics | Rating | Rank | Unemployment Among Ages 35 to 44 years |
| Lumbee | 0.0 /100 | #278 | Tragic 5.4% |
| Immigrants | Senegal | 0.0 /100 | #279 | Tragic 5.4% |
| Ecuadorians | 0.0 /100 | #280 | Tragic 5.4% |
| Immigrants | Portugal | 0.0 /100 | #281 | Tragic 5.4% |
| Immigrants | Ghana | 0.0 /100 | #282 | Tragic 5.4% |
| Immigrants | Ecuador | 0.0 /100 | #283 | Tragic 5.4% |
| Haitians | 0.0 /100 | #284 | Tragic 5.5% |
| Hispanics or Latinos | 0.0 /100 | #285 | Tragic 5.5% |
| Immigrants | Micronesia | 0.0 /100 | #286 | Tragic 5.5% |
| French American Indians | 0.0 /100 | #287 | Tragic 5.5% |
| Cree | 0.0 /100 | #288 | Tragic 5.5% |
| Spanish American Indians | 0.0 /100 | #289 | Tragic 5.5% |
| Jamaicans | 0.0 /100 | #290 | Tragic 5.5% |
| Dutch West Indians | 0.0 /100 | #291 | Tragic 5.5% |
| Immigrants | Haiti | 0.0 /100 | #292 | Tragic 5.5% |
Demographics Similar to Ghanaians by Unemployment Among Ages 35 to 44 years
In terms of unemployment among ages 35 to 44 years, the demographic groups most similar to Ghanaians are Choctaw (5.3%, a difference of 0.0%), Immigrants from Central America (5.3%, a difference of 0.070%), Yaqui (5.3%, a difference of 0.19%), Immigrants from Bangladesh (5.3%, a difference of 0.21%), and Immigrants from Western Africa (5.3%, a difference of 0.34%).
| Demographics | Rating | Rank | Unemployment Among Ages 35 to 44 years |
| Immigrants | Fiji | 0.1 /100 | #257 | Tragic 5.3% |
| Immigrants | Latin America | 0.1 /100 | #258 | Tragic 5.3% |
| Mexicans | 0.1 /100 | #259 | Tragic 5.3% |
| Sub-Saharan Africans | 0.1 /100 | #260 | Tragic 5.3% |
| Spanish Americans | 0.1 /100 | #261 | Tragic 5.3% |
| Immigrants | Central America | 0.1 /100 | #262 | Tragic 5.3% |
| Choctaw | 0.1 /100 | #263 | Tragic 5.3% |
| Ghanaians | 0.1 /100 | #264 | Tragic 5.3% |
| Yaqui | 0.1 /100 | #265 | Tragic 5.3% |
| Immigrants | Bangladesh | 0.1 /100 | #266 | Tragic 5.3% |
| Immigrants | Western Africa | 0.0 /100 | #267 | Tragic 5.3% |
| Hawaiians | 0.0 /100 | #268 | Tragic 5.3% |
| Cajuns | 0.0 /100 | #269 | Tragic 5.3% |
| Blackfeet | 0.0 /100 | #270 | Tragic 5.3% |
| Ute | 0.0 /100 | #271 | Tragic 5.3% |