Lithuanian vs Native/Alaskan Unemployment Among Seniors over 75 years
COMPARE
Lithuanian
Native/Alaskan
Unemployment Among Seniors over 75 years
Unemployment Among Seniors over 75 years Comparison
Lithuanians
Natives/Alaskans
9.9%
UNEMPLOYMENT AMONG SENIORS OVER 75 YEARS
0.0/ 100
METRIC RATING
298th/ 347
METRIC RANK
10.2%
UNEMPLOYMENT AMONG SENIORS OVER 75 YEARS
0.0/ 100
METRIC RATING
316th/ 347
METRIC RANK
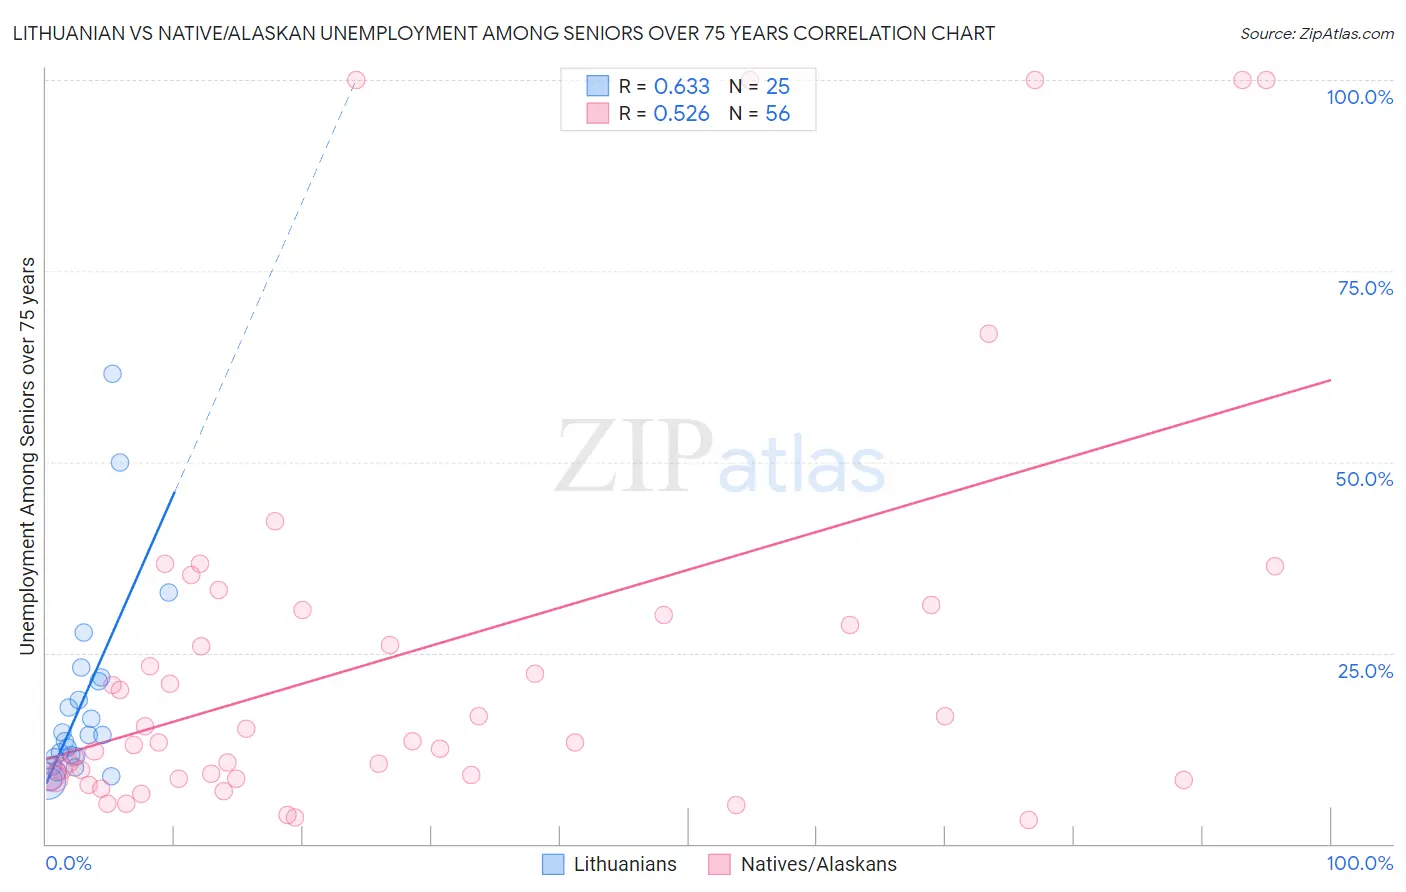
Lithuanian vs Native/Alaskan Unemployment Among Seniors over 75 years Correlation Chart
The statistical analysis conducted on geographies consisting of 208,094,168 people shows a significant positive correlation between the proportion of Lithuanians and unemployment rate among seniors over the age of 75 in the United States with a correlation coefficient (R) of 0.633 and weighted average of 9.9%. Similarly, the statistical analysis conducted on geographies consisting of 226,317,213 people shows a substantial positive correlation between the proportion of Natives/Alaskans and unemployment rate among seniors over the age of 75 in the United States with a correlation coefficient (R) of 0.526 and weighted average of 10.2%, a difference of 3.2%.
Unemployment Among Seniors over 75 years Correlation Summary
| Measurement | Lithuanian | Native/Alaskan |
| Minimum | 8.1% | 3.1% |
| Maximum | 61.5% | 100.0% |
| Range | 53.4% | 96.9% |
| Mean | 18.5% | 24.8% |
| Median | 14.2% | 13.4% |
| Interquartile 25% (IQ1) | 10.8% | 8.8% |
| Interquartile 75% (IQ3) | 21.5% | 30.3% |
| Interquartile Range (IQR) | 10.8% | 21.5% |
| Standard Deviation (Sample) | 12.9% | 26.7% |
| Standard Deviation (Population) | 12.7% | 26.4% |
Demographics Similar to Lithuanians and Natives/Alaskans by Unemployment Among Seniors over 75 years
In terms of unemployment among seniors over 75 years, the demographic groups most similar to Lithuanians are Belgian (9.9%, a difference of 0.28%), Iraqi (9.9%, a difference of 0.30%), Cherokee (9.8%, a difference of 0.38%), Welsh (10.0%, a difference of 0.73%), and Finnish (10.0%, a difference of 0.83%). Similarly, the demographic groups most similar to Natives/Alaskans are Pennsylvania German (10.2%, a difference of 0.24%), Dutch West Indian (10.2%, a difference of 0.36%), Irish (10.2%, a difference of 0.37%), Nepalese (10.1%, a difference of 0.80%), and Chippewa (10.1%, a difference of 0.92%).
| Demographics | Rating | Rank | Unemployment Among Seniors over 75 years |
| Cherokee | 0.0 /100 | #297 | Tragic 9.8% |
| Lithuanians | 0.0 /100 | #298 | Tragic 9.9% |
| Belgians | 0.0 /100 | #299 | Tragic 9.9% |
| Iraqis | 0.0 /100 | #300 | Tragic 9.9% |
| Welsh | 0.0 /100 | #301 | Tragic 10.0% |
| Finns | 0.0 /100 | #302 | Tragic 10.0% |
| Puget Sound Salish | 0.0 /100 | #303 | Tragic 10.0% |
| Scotch-Irish | 0.0 /100 | #304 | Tragic 10.0% |
| Swedes | 0.0 /100 | #305 | Tragic 10.0% |
| Italians | 0.0 /100 | #306 | Tragic 10.0% |
| Immigrants | Fiji | 0.0 /100 | #307 | Tragic 10.0% |
| Whites/Caucasians | 0.0 /100 | #308 | Tragic 10.1% |
| English | 0.0 /100 | #309 | Tragic 10.1% |
| Hungarians | 0.0 /100 | #310 | Tragic 10.1% |
| Scottish | 0.0 /100 | #311 | Tragic 10.1% |
| Chippewa | 0.0 /100 | #312 | Tragic 10.1% |
| Nepalese | 0.0 /100 | #313 | Tragic 10.1% |
| Dutch West Indians | 0.0 /100 | #314 | Tragic 10.2% |
| Pennsylvania Germans | 0.0 /100 | #315 | Tragic 10.2% |
| Natives/Alaskans | 0.0 /100 | #316 | Tragic 10.2% |
| Irish | 0.0 /100 | #317 | Tragic 10.2% |