Immigrants from Guatemala vs Native/Alaskan Unemployment Among Seniors over 75 years
COMPARE
Immigrants from Guatemala
Native/Alaskan
Unemployment Among Seniors over 75 years
Unemployment Among Seniors over 75 years Comparison
Immigrants from Guatemala
Natives/Alaskans
8.7%
UNEMPLOYMENT AMONG SENIORS OVER 75 YEARS
68.4/ 100
METRIC RATING
163rd/ 347
METRIC RANK
10.2%
UNEMPLOYMENT AMONG SENIORS OVER 75 YEARS
0.0/ 100
METRIC RATING
316th/ 347
METRIC RANK
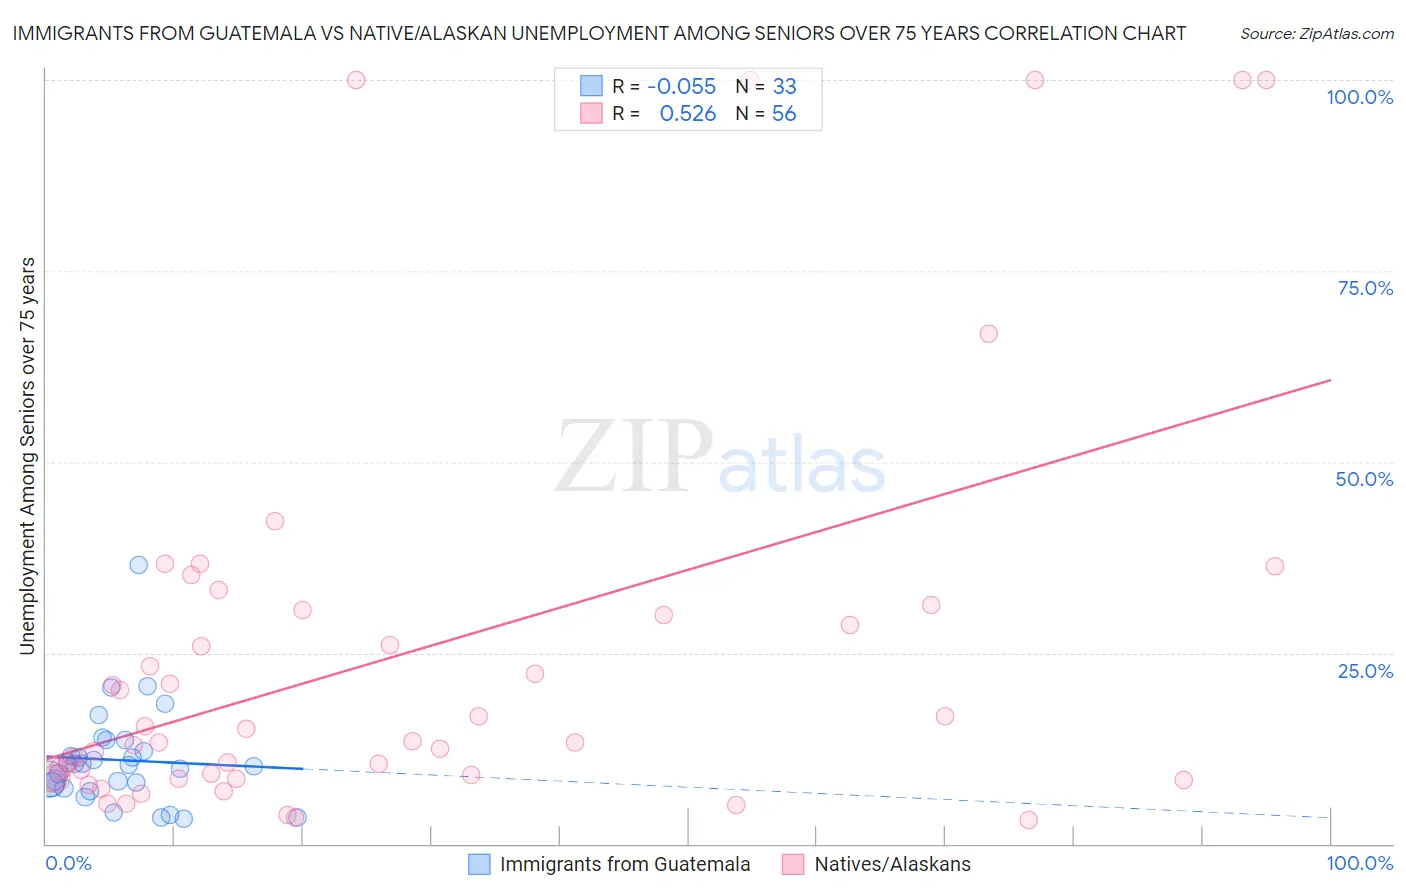
Immigrants from Guatemala vs Native/Alaskan Unemployment Among Seniors over 75 years Correlation Chart
The statistical analysis conducted on geographies consisting of 194,202,123 people shows a slight negative correlation between the proportion of Immigrants from Guatemala and unemployment rate among seniors over the age of 75 in the United States with a correlation coefficient (R) of -0.055 and weighted average of 8.7%. Similarly, the statistical analysis conducted on geographies consisting of 226,317,213 people shows a substantial positive correlation between the proportion of Natives/Alaskans and unemployment rate among seniors over the age of 75 in the United States with a correlation coefficient (R) of 0.526 and weighted average of 10.2%, a difference of 17.8%.
Unemployment Among Seniors over 75 years Correlation Summary
| Measurement | Immigrants from Guatemala | Native/Alaskan |
| Minimum | 3.2% | 3.1% |
| Maximum | 36.5% | 100.0% |
| Range | 33.3% | 96.9% |
| Mean | 11.0% | 24.8% |
| Median | 10.4% | 13.4% |
| Interquartile 25% (IQ1) | 7.5% | 8.8% |
| Interquartile 75% (IQ3) | 12.9% | 30.3% |
| Interquartile Range (IQR) | 5.4% | 21.5% |
| Standard Deviation (Sample) | 6.4% | 26.7% |
| Standard Deviation (Population) | 6.3% | 26.4% |
Similar Demographics by Unemployment Among Seniors over 75 years
Demographics Similar to Immigrants from Guatemala by Unemployment Among Seniors over 75 years
In terms of unemployment among seniors over 75 years, the demographic groups most similar to Immigrants from Guatemala are Immigrants from South America (8.6%, a difference of 0.19%), Cree (8.6%, a difference of 0.29%), Albanian (8.6%, a difference of 0.29%), Paraguayan (8.7%, a difference of 0.37%), and Shoshone (8.6%, a difference of 0.41%).
| Demographics | Rating | Rank | Unemployment Among Seniors over 75 years |
| Immigrants | Bahamas | 76.5 /100 | #156 | Good 8.6% |
| Turks | 76.4 /100 | #157 | Good 8.6% |
| Ethiopians | 75.3 /100 | #158 | Good 8.6% |
| Shoshone | 74.6 /100 | #159 | Good 8.6% |
| Cree | 72.8 /100 | #160 | Good 8.6% |
| Albanians | 72.8 /100 | #161 | Good 8.6% |
| Immigrants | South America | 71.3 /100 | #162 | Good 8.6% |
| Immigrants | Guatemala | 68.4 /100 | #163 | Good 8.7% |
| Paraguayans | 62.2 /100 | #164 | Good 8.7% |
| Immigrants | Dominican Republic | 61.4 /100 | #165 | Good 8.7% |
| Immigrants | Belize | 57.6 /100 | #166 | Average 8.7% |
| Immigrants | Eastern Africa | 57.6 /100 | #167 | Average 8.7% |
| Immigrants | Lithuania | 57.2 /100 | #168 | Average 8.7% |
| Fijians | 56.4 /100 | #169 | Average 8.7% |
| Zimbabweans | 54.1 /100 | #170 | Average 8.7% |
Demographics Similar to Natives/Alaskans by Unemployment Among Seniors over 75 years
In terms of unemployment among seniors over 75 years, the demographic groups most similar to Natives/Alaskans are Pennsylvania German (10.2%, a difference of 0.24%), Dutch West Indian (10.2%, a difference of 0.36%), Irish (10.2%, a difference of 0.37%), Liberian (10.2%, a difference of 0.49%), and German (10.3%, a difference of 0.56%).
| Demographics | Rating | Rank | Unemployment Among Seniors over 75 years |
| English | 0.0 /100 | #309 | Tragic 10.1% |
| Hungarians | 0.0 /100 | #310 | Tragic 10.1% |
| Scottish | 0.0 /100 | #311 | Tragic 10.1% |
| Chippewa | 0.0 /100 | #312 | Tragic 10.1% |
| Nepalese | 0.0 /100 | #313 | Tragic 10.1% |
| Dutch West Indians | 0.0 /100 | #314 | Tragic 10.2% |
| Pennsylvania Germans | 0.0 /100 | #315 | Tragic 10.2% |
| Natives/Alaskans | 0.0 /100 | #316 | Tragic 10.2% |
| Irish | 0.0 /100 | #317 | Tragic 10.2% |
| Liberians | 0.0 /100 | #318 | Tragic 10.2% |
| Germans | 0.0 /100 | #319 | Tragic 10.3% |
| French | 0.0 /100 | #320 | Tragic 10.3% |
| Aleuts | 0.0 /100 | #321 | Tragic 10.3% |
| Poles | 0.0 /100 | #322 | Tragic 10.3% |
| Tongans | 0.0 /100 | #323 | Tragic 10.4% |