Liberian vs Tohono O'odham Female Unemployment
COMPARE
Liberian
Tohono O'odham
Female Unemployment
Female Unemployment Comparison
Liberians
Tohono O'odham
5.5%
FEMALE UNEMPLOYMENT
3.9/ 100
METRIC RATING
232nd/ 347
METRIC RANK
7.7%
FEMALE UNEMPLOYMENT
0.0/ 100
METRIC RATING
338th/ 347
METRIC RANK
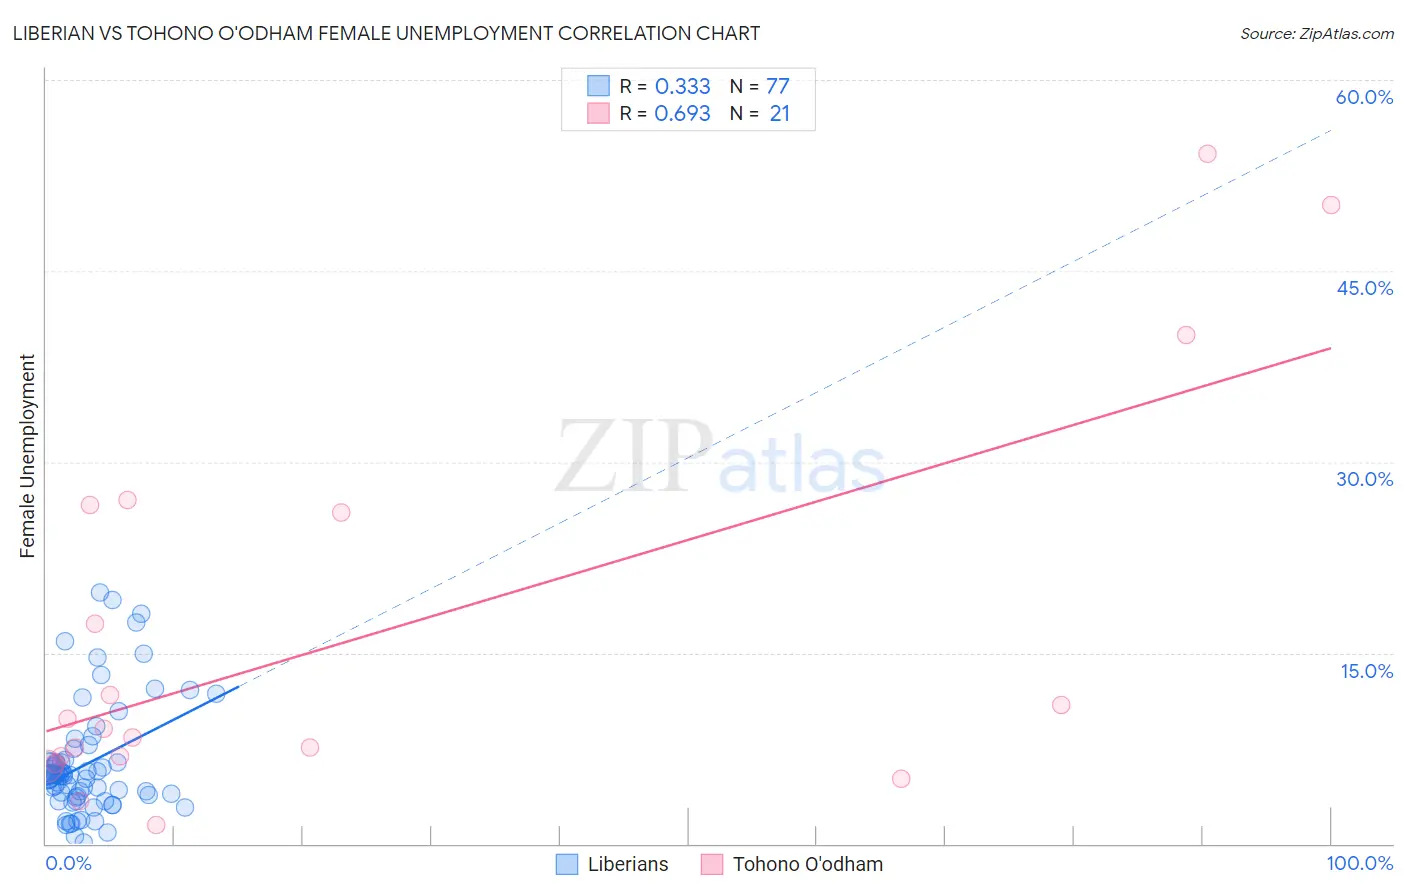
Liberian vs Tohono O'odham Female Unemployment Correlation Chart
The statistical analysis conducted on geographies consisting of 117,959,005 people shows a mild positive correlation between the proportion of Liberians and unemploymnet rate among females in the United States with a correlation coefficient (R) of 0.333 and weighted average of 5.5%. Similarly, the statistical analysis conducted on geographies consisting of 58,685,659 people shows a significant positive correlation between the proportion of Tohono O'odham and unemploymnet rate among females in the United States with a correlation coefficient (R) of 0.693 and weighted average of 7.7%, a difference of 40.6%.
Female Unemployment Correlation Summary
| Measurement | Liberian | Tohono O'odham |
| Minimum | 0.10% | 1.5% |
| Maximum | 19.7% | 54.2% |
| Range | 19.6% | 52.7% |
| Mean | 6.3% | 16.3% |
| Median | 5.4% | 9.0% |
| Interquartile 25% (IQ1) | 3.6% | 6.6% |
| Interquartile 75% (IQ3) | 6.5% | 26.3% |
| Interquartile Range (IQR) | 2.9% | 19.8% |
| Standard Deviation (Sample) | 4.4% | 15.4% |
| Standard Deviation (Population) | 4.4% | 15.0% |
Similar Demographics by Female Unemployment
Demographics Similar to Liberians by Female Unemployment
In terms of female unemployment, the demographic groups most similar to Liberians are Immigrants from Iraq (5.5%, a difference of 0.010%), Moroccan (5.5%, a difference of 0.21%), Immigrants from Lebanon (5.5%, a difference of 0.23%), Immigrants from Iran (5.5%, a difference of 0.23%), and Immigrants from Cambodia (5.5%, a difference of 0.27%).
| Demographics | Rating | Rank | Female Unemployment |
| French American Indians | 6.1 /100 | #225 | Tragic 5.5% |
| Immigrants | Peru | 5.9 /100 | #226 | Tragic 5.5% |
| Immigrants | Philippines | 5.3 /100 | #227 | Tragic 5.5% |
| Israelis | 4.8 /100 | #228 | Tragic 5.5% |
| Panamanians | 4.7 /100 | #229 | Tragic 5.5% |
| Immigrants | Uruguay | 4.7 /100 | #230 | Tragic 5.5% |
| Immigrants | Iraq | 3.9 /100 | #231 | Tragic 5.5% |
| Liberians | 3.9 /100 | #232 | Tragic 5.5% |
| Moroccans | 3.4 /100 | #233 | Tragic 5.5% |
| Immigrants | Lebanon | 3.3 /100 | #234 | Tragic 5.5% |
| Immigrants | Iran | 3.3 /100 | #235 | Tragic 5.5% |
| Immigrants | Cambodia | 3.3 /100 | #236 | Tragic 5.5% |
| Immigrants | Panama | 3.2 /100 | #237 | Tragic 5.5% |
| Sierra Leoneans | 3.2 /100 | #238 | Tragic 5.5% |
| Aleuts | 3.0 /100 | #239 | Tragic 5.5% |
Demographics Similar to Tohono O'odham by Female Unemployment
In terms of female unemployment, the demographic groups most similar to Tohono O'odham are Immigrants from Yemen (7.8%, a difference of 1.2%), Hopi (8.1%, a difference of 4.5%), Inupiat (8.2%, a difference of 5.3%), Navajo (7.3%, a difference of 6.3%), and Immigrants from Dominican Republic (7.2%, a difference of 7.3%).
| Demographics | Rating | Rank | Female Unemployment |
| Paiute | 0.0 /100 | #331 | Tragic 6.8% |
| Sioux | 0.0 /100 | #332 | Tragic 7.0% |
| Menominee | 0.0 /100 | #333 | Tragic 7.0% |
| Immigrants | Armenia | 0.0 /100 | #334 | Tragic 7.1% |
| Dominicans | 0.0 /100 | #335 | Tragic 7.2% |
| Immigrants | Dominican Republic | 0.0 /100 | #336 | Tragic 7.2% |
| Navajo | 0.0 /100 | #337 | Tragic 7.3% |
| Tohono O'odham | 0.0 /100 | #338 | Tragic 7.7% |
| Immigrants | Yemen | 0.0 /100 | #339 | Tragic 7.8% |
| Hopi | 0.0 /100 | #340 | Tragic 8.1% |
| Inupiat | 0.0 /100 | #341 | Tragic 8.2% |
| Puerto Ricans | 0.0 /100 | #342 | Tragic 8.3% |
| Arapaho | 0.0 /100 | #343 | Tragic 8.8% |
| Pima | 0.0 /100 | #344 | Tragic 9.3% |
| Yuman | 0.0 /100 | #345 | Tragic 9.6% |