Liberian vs African Female Unemployment
COMPARE
Liberian
African
Female Unemployment
Female Unemployment Comparison
Liberians
Africans
5.5%
FEMALE UNEMPLOYMENT
3.9/ 100
METRIC RATING
232nd/ 347
METRIC RANK
5.9%
FEMALE UNEMPLOYMENT
0.0/ 100
METRIC RATING
274th/ 347
METRIC RANK
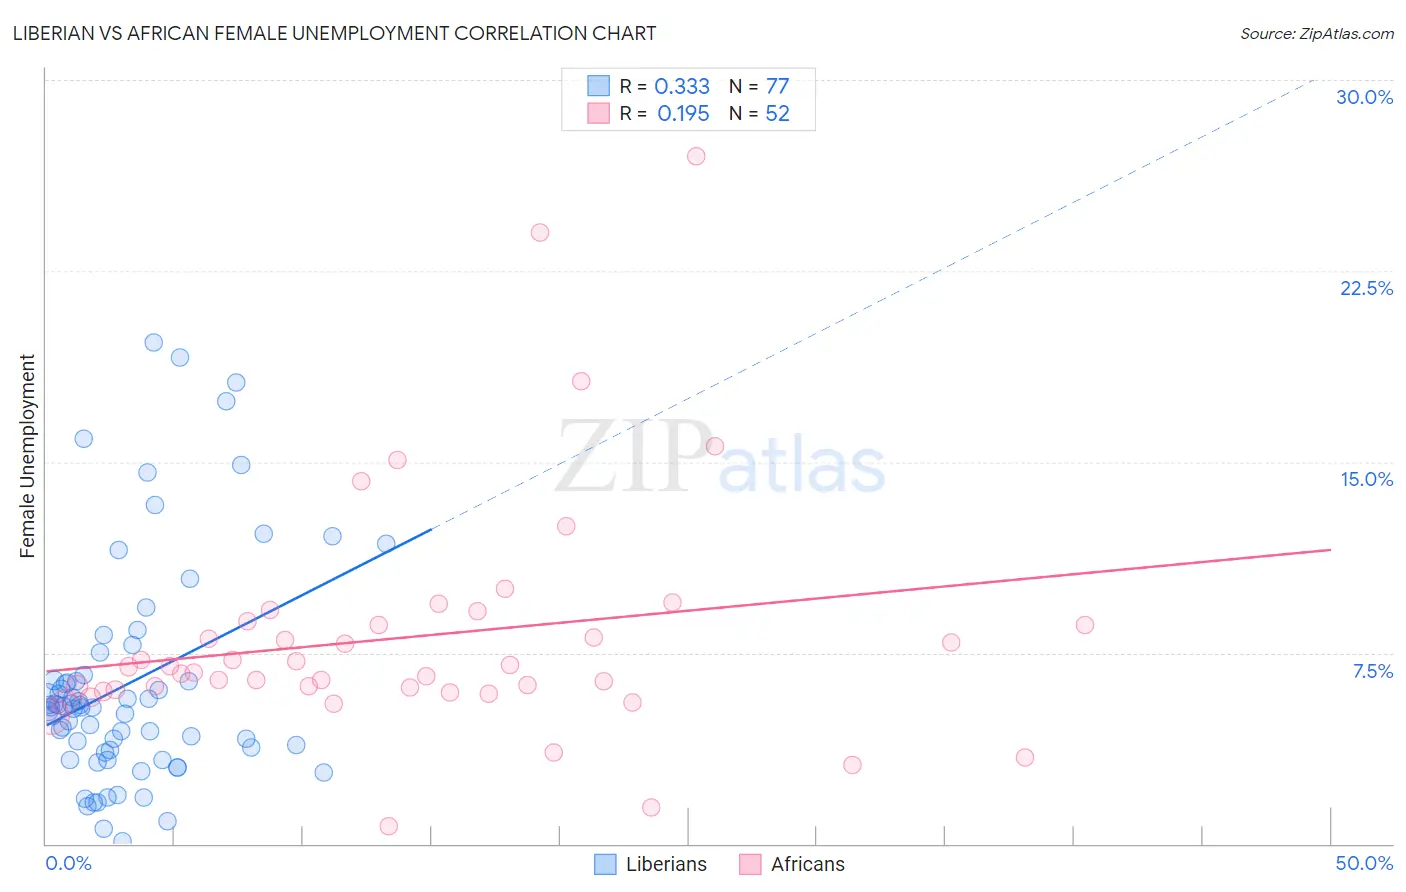
Liberian vs African Female Unemployment Correlation Chart
The statistical analysis conducted on geographies consisting of 117,959,005 people shows a mild positive correlation between the proportion of Liberians and unemploymnet rate among females in the United States with a correlation coefficient (R) of 0.333 and weighted average of 5.5%. Similarly, the statistical analysis conducted on geographies consisting of 467,075,487 people shows a poor positive correlation between the proportion of Africans and unemploymnet rate among females in the United States with a correlation coefficient (R) of 0.195 and weighted average of 5.9%, a difference of 8.0%.
Female Unemployment Correlation Summary
| Measurement | Liberian | African |
| Minimum | 0.10% | 0.68% |
| Maximum | 19.7% | 27.0% |
| Range | 19.6% | 26.3% |
| Mean | 6.3% | 8.1% |
| Median | 5.4% | 6.8% |
| Interquartile 25% (IQ1) | 3.6% | 6.0% |
| Interquartile 75% (IQ3) | 6.5% | 8.7% |
| Interquartile Range (IQR) | 2.9% | 2.7% |
| Standard Deviation (Sample) | 4.4% | 4.7% |
| Standard Deviation (Population) | 4.4% | 4.7% |
Similar Demographics by Female Unemployment
Demographics Similar to Liberians by Female Unemployment
In terms of female unemployment, the demographic groups most similar to Liberians are Immigrants from Iraq (5.5%, a difference of 0.010%), Moroccan (5.5%, a difference of 0.21%), Immigrants from Lebanon (5.5%, a difference of 0.23%), Immigrants from Iran (5.5%, a difference of 0.23%), and Immigrants from Cambodia (5.5%, a difference of 0.27%).
| Demographics | Rating | Rank | Female Unemployment |
| French American Indians | 6.1 /100 | #225 | Tragic 5.5% |
| Immigrants | Peru | 5.9 /100 | #226 | Tragic 5.5% |
| Immigrants | Philippines | 5.3 /100 | #227 | Tragic 5.5% |
| Israelis | 4.8 /100 | #228 | Tragic 5.5% |
| Panamanians | 4.7 /100 | #229 | Tragic 5.5% |
| Immigrants | Uruguay | 4.7 /100 | #230 | Tragic 5.5% |
| Immigrants | Iraq | 3.9 /100 | #231 | Tragic 5.5% |
| Liberians | 3.9 /100 | #232 | Tragic 5.5% |
| Moroccans | 3.4 /100 | #233 | Tragic 5.5% |
| Immigrants | Lebanon | 3.3 /100 | #234 | Tragic 5.5% |
| Immigrants | Iran | 3.3 /100 | #235 | Tragic 5.5% |
| Immigrants | Cambodia | 3.3 /100 | #236 | Tragic 5.5% |
| Immigrants | Panama | 3.2 /100 | #237 | Tragic 5.5% |
| Sierra Leoneans | 3.2 /100 | #238 | Tragic 5.5% |
| Aleuts | 3.0 /100 | #239 | Tragic 5.5% |
Demographics Similar to Africans by Female Unemployment
In terms of female unemployment, the demographic groups most similar to Africans are Ghanaian (5.9%, a difference of 0.080%), Lumbee (5.9%, a difference of 0.090%), Central American (5.9%, a difference of 0.28%), Immigrants from Honduras (5.9%, a difference of 0.38%), and Senegalese (6.0%, a difference of 0.49%).
| Demographics | Rating | Rank | Female Unemployment |
| Nepalese | 0.0 /100 | #267 | Tragic 5.9% |
| Hondurans | 0.0 /100 | #268 | Tragic 5.9% |
| Immigrants | Western Africa | 0.0 /100 | #269 | Tragic 5.9% |
| Immigrants | Honduras | 0.0 /100 | #270 | Tragic 5.9% |
| Central Americans | 0.0 /100 | #271 | Tragic 5.9% |
| Lumbee | 0.0 /100 | #272 | Tragic 5.9% |
| Ghanaians | 0.0 /100 | #273 | Tragic 5.9% |
| Africans | 0.0 /100 | #274 | Tragic 5.9% |
| Senegalese | 0.0 /100 | #275 | Tragic 6.0% |
| Bahamians | 0.0 /100 | #276 | Tragic 6.0% |
| Immigrants | Ghana | 0.0 /100 | #277 | Tragic 6.0% |
| Yaqui | 0.0 /100 | #278 | Tragic 6.0% |
| Armenians | 0.0 /100 | #279 | Tragic 6.0% |
| Mexican American Indians | 0.0 /100 | #280 | Tragic 6.0% |
| Guatemalans | 0.0 /100 | #281 | Tragic 6.0% |