Latvian vs Immigrants from North America Unemployment Among Ages 30 to 34 years
COMPARE
Latvian
Immigrants from North America
Unemployment Among Ages 30 to 34 years
Unemployment Among Ages 30 to 34 years Comparison
Latvians
Immigrants from North America
5.0%
UNEMPLOYMENT AMONG AGES 30 TO 34 YEARS
99.3/ 100
METRIC RATING
34th/ 347
METRIC RANK
5.4%
UNEMPLOYMENT AMONG AGES 30 TO 34 YEARS
72.2/ 100
METRIC RATING
140th/ 347
METRIC RANK
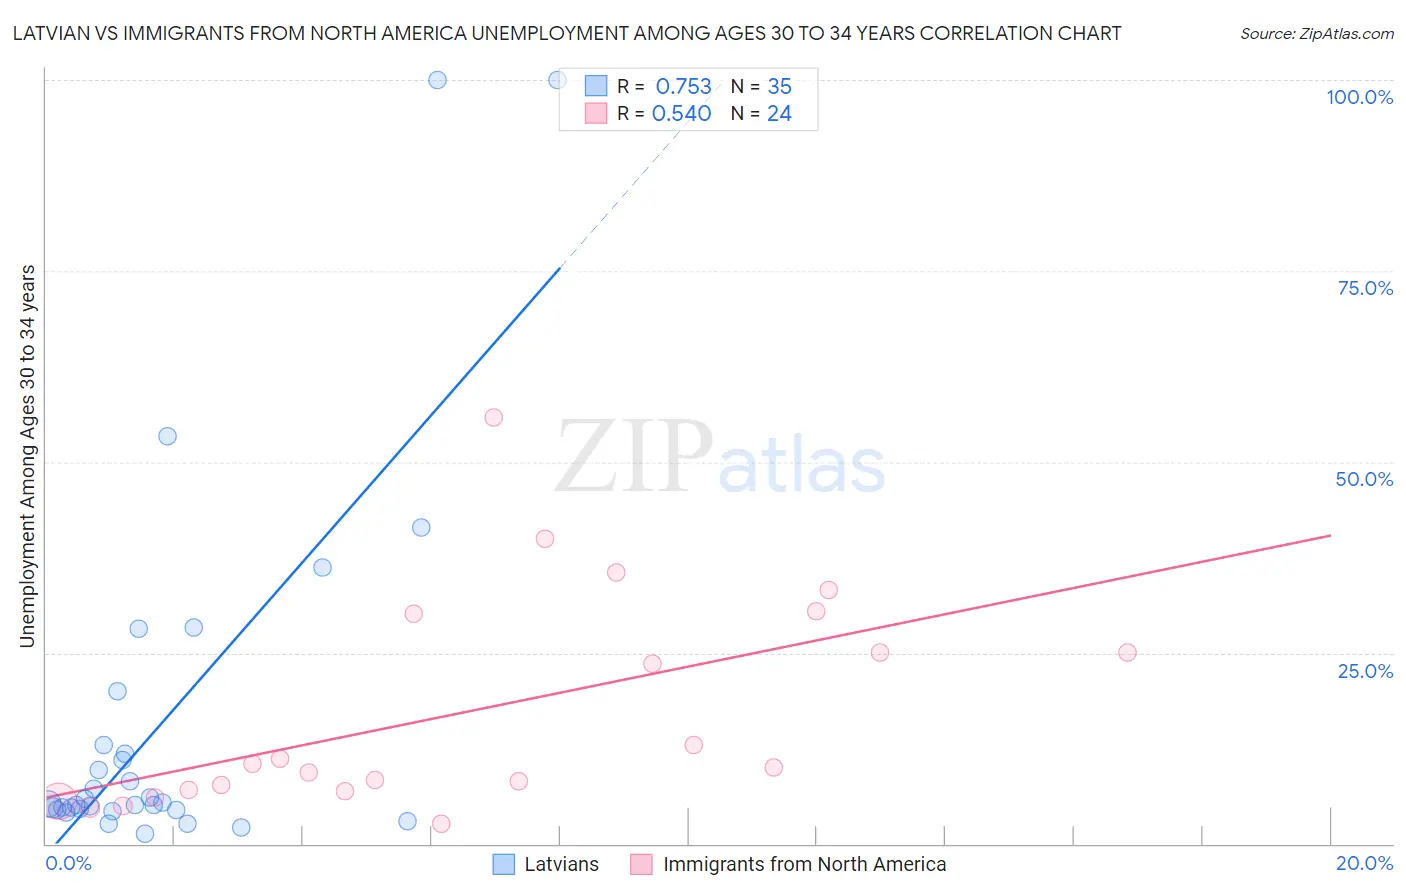
Latvian vs Immigrants from North America Unemployment Among Ages 30 to 34 years Correlation Chart
The statistical analysis conducted on geographies consisting of 211,593,326 people shows a strong positive correlation between the proportion of Latvians and unemployment rate among population between the ages 30 and 34 in the United States with a correlation coefficient (R) of 0.753 and weighted average of 5.0%. Similarly, the statistical analysis conducted on geographies consisting of 425,298,151 people shows a substantial positive correlation between the proportion of Immigrants from North America and unemployment rate among population between the ages 30 and 34 in the United States with a correlation coefficient (R) of 0.540 and weighted average of 5.4%, a difference of 7.5%.
Unemployment Among Ages 30 to 34 years Correlation Summary
| Measurement | Latvian | Immigrants from North America |
| Minimum | 1.2% | 2.7% |
| Maximum | 100.0% | 55.8% |
| Range | 98.8% | 53.1% |
| Mean | 15.9% | 17.3% |
| Median | 5.2% | 10.2% |
| Interquartile 25% (IQ1) | 4.4% | 7.0% |
| Interquartile 75% (IQ3) | 12.9% | 27.5% |
| Interquartile Range (IQR) | 8.4% | 20.5% |
| Standard Deviation (Sample) | 24.3% | 14.1% |
| Standard Deviation (Population) | 23.9% | 13.8% |
Similar Demographics by Unemployment Among Ages 30 to 34 years
Demographics Similar to Latvians by Unemployment Among Ages 30 to 34 years
In terms of unemployment among ages 30 to 34 years, the demographic groups most similar to Latvians are Immigrants from Saudi Arabia (5.0%, a difference of 0.050%), Immigrants from Zaire (5.0%, a difference of 0.14%), Somali (5.0%, a difference of 0.19%), Immigrants from Ethiopia (5.0%, a difference of 0.23%), and Norwegian (5.0%, a difference of 0.28%).
| Demographics | Rating | Rank | Unemployment Among Ages 30 to 34 years |
| Danes | 99.5 /100 | #27 | Exceptional 5.0% |
| Immigrants | Cuba | 99.4 /100 | #28 | Exceptional 5.0% |
| German Russians | 99.4 /100 | #29 | Exceptional 5.0% |
| Norwegians | 99.4 /100 | #30 | Exceptional 5.0% |
| Somalis | 99.3 /100 | #31 | Exceptional 5.0% |
| Immigrants | Zaire | 99.3 /100 | #32 | Exceptional 5.0% |
| Immigrants | Saudi Arabia | 99.3 /100 | #33 | Exceptional 5.0% |
| Latvians | 99.3 /100 | #34 | Exceptional 5.0% |
| Immigrants | Ethiopia | 99.2 /100 | #35 | Exceptional 5.0% |
| Czechs | 99.2 /100 | #36 | Exceptional 5.0% |
| Immigrants | Turkey | 99.0 /100 | #37 | Exceptional 5.0% |
| Sri Lankans | 99.0 /100 | #38 | Exceptional 5.0% |
| Fijians | 99.0 /100 | #39 | Exceptional 5.0% |
| Immigrants | Vietnam | 98.9 /100 | #40 | Exceptional 5.0% |
| Immigrants | Eastern Africa | 98.9 /100 | #41 | Exceptional 5.0% |
Demographics Similar to Immigrants from North America by Unemployment Among Ages 30 to 34 years
In terms of unemployment among ages 30 to 34 years, the demographic groups most similar to Immigrants from North America are Lithuanian (5.4%, a difference of 0.020%), Immigrants from Europe (5.4%, a difference of 0.020%), Immigrants from Greece (5.4%, a difference of 0.020%), Serbian (5.4%, a difference of 0.060%), and Russian (5.4%, a difference of 0.090%).
| Demographics | Rating | Rank | Unemployment Among Ages 30 to 34 years |
| Immigrants | Northern Europe | 77.3 /100 | #133 | Good 5.3% |
| Bangladeshis | 76.6 /100 | #134 | Good 5.3% |
| Palestinians | 75.1 /100 | #135 | Good 5.4% |
| Pakistanis | 74.6 /100 | #136 | Good 5.4% |
| Immigrants | Canada | 74.6 /100 | #137 | Good 5.4% |
| Serbians | 72.9 /100 | #138 | Good 5.4% |
| Lithuanians | 72.4 /100 | #139 | Good 5.4% |
| Immigrants | North America | 72.2 /100 | #140 | Good 5.4% |
| Immigrants | Europe | 72.1 /100 | #141 | Good 5.4% |
| Immigrants | Greece | 72.0 /100 | #142 | Good 5.4% |
| Russians | 71.1 /100 | #143 | Good 5.4% |
| Immigrants | Russia | 71.0 /100 | #144 | Good 5.4% |
| Syrians | 70.3 /100 | #145 | Good 5.4% |
| Celtics | 70.2 /100 | #146 | Good 5.4% |
| Ukrainians | 69.2 /100 | #147 | Good 5.4% |