Immigrants from the Azores vs Immigrants from North America Unemployment Among Ages 30 to 34 years
COMPARE
Immigrants from the Azores
Immigrants from North America
Unemployment Among Ages 30 to 34 years
Unemployment Among Ages 30 to 34 years Comparison
Immigrants from the Azores
Immigrants from North America
6.9%
UNEMPLOYMENT AMONG AGES 30 TO 34 YEARS
0.0/ 100
METRIC RATING
308th/ 347
METRIC RANK
5.4%
UNEMPLOYMENT AMONG AGES 30 TO 34 YEARS
72.2/ 100
METRIC RATING
140th/ 347
METRIC RANK
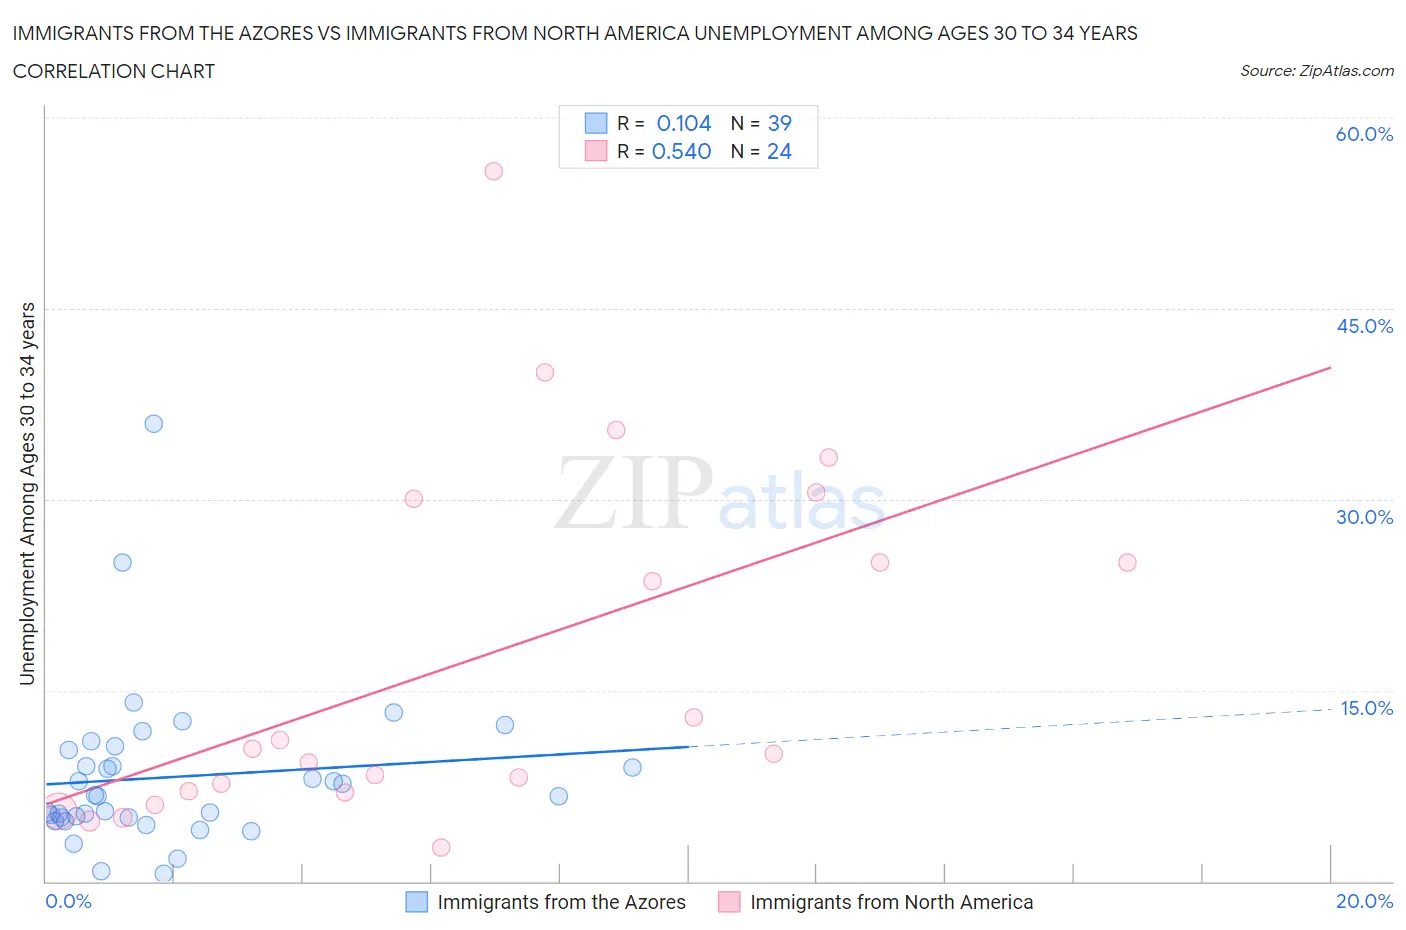
Immigrants from the Azores vs Immigrants from North America Unemployment Among Ages 30 to 34 years Correlation Chart
The statistical analysis conducted on geographies consisting of 45,190,975 people shows a poor positive correlation between the proportion of Immigrants from the Azores and unemployment rate among population between the ages 30 and 34 in the United States with a correlation coefficient (R) of 0.104 and weighted average of 6.9%. Similarly, the statistical analysis conducted on geographies consisting of 425,298,151 people shows a substantial positive correlation between the proportion of Immigrants from North America and unemployment rate among population between the ages 30 and 34 in the United States with a correlation coefficient (R) of 0.540 and weighted average of 5.4%, a difference of 28.3%.
Unemployment Among Ages 30 to 34 years Correlation Summary
| Measurement | Immigrants from the Azores | Immigrants from North America |
| Minimum | 0.60% | 2.7% |
| Maximum | 36.0% | 55.8% |
| Range | 35.4% | 53.1% |
| Mean | 8.2% | 17.3% |
| Median | 6.7% | 10.2% |
| Interquartile 25% (IQ1) | 5.0% | 7.0% |
| Interquartile 75% (IQ3) | 10.3% | 27.5% |
| Interquartile Range (IQR) | 5.3% | 20.5% |
| Standard Deviation (Sample) | 6.3% | 14.1% |
| Standard Deviation (Population) | 6.3% | 13.8% |
Similar Demographics by Unemployment Among Ages 30 to 34 years
Demographics Similar to Immigrants from the Azores by Unemployment Among Ages 30 to 34 years
In terms of unemployment among ages 30 to 34 years, the demographic groups most similar to Immigrants from the Azores are Immigrants from Belize (6.9%, a difference of 0.38%), Immigrants from Armenia (6.8%, a difference of 0.57%), Immigrants from Grenada (6.9%, a difference of 0.68%), Immigrants from St. Vincent and the Grenadines (7.0%, a difference of 1.0%), and Alaskan Athabascan (7.0%, a difference of 2.1%).
| Demographics | Rating | Rank | Unemployment Among Ages 30 to 34 years |
| Belizeans | 0.0 /100 | #301 | Tragic 6.6% |
| Delaware | 0.0 /100 | #302 | Tragic 6.7% |
| Cajuns | 0.0 /100 | #303 | Tragic 6.7% |
| Kiowa | 0.0 /100 | #304 | Tragic 6.7% |
| Paiute | 0.0 /100 | #305 | Tragic 6.7% |
| Immigrants | Armenia | 0.0 /100 | #306 | Tragic 6.8% |
| Immigrants | Belize | 0.0 /100 | #307 | Tragic 6.9% |
| Immigrants | Azores | 0.0 /100 | #308 | Tragic 6.9% |
| Immigrants | Grenada | 0.0 /100 | #309 | Tragic 6.9% |
| Immigrants | St. Vincent and the Grenadines | 0.0 /100 | #310 | Tragic 7.0% |
| Alaskan Athabascans | 0.0 /100 | #311 | Tragic 7.0% |
| British West Indians | 0.0 /100 | #312 | Tragic 7.0% |
| Ute | 0.0 /100 | #313 | Tragic 7.0% |
| Lumbee | 0.0 /100 | #314 | Tragic 7.1% |
| Aleuts | 0.0 /100 | #315 | Tragic 7.1% |
Demographics Similar to Immigrants from North America by Unemployment Among Ages 30 to 34 years
In terms of unemployment among ages 30 to 34 years, the demographic groups most similar to Immigrants from North America are Lithuanian (5.4%, a difference of 0.020%), Immigrants from Europe (5.4%, a difference of 0.020%), Immigrants from Greece (5.4%, a difference of 0.020%), Serbian (5.4%, a difference of 0.060%), and Russian (5.4%, a difference of 0.090%).
| Demographics | Rating | Rank | Unemployment Among Ages 30 to 34 years |
| Immigrants | Northern Europe | 77.3 /100 | #133 | Good 5.3% |
| Bangladeshis | 76.6 /100 | #134 | Good 5.3% |
| Palestinians | 75.1 /100 | #135 | Good 5.4% |
| Pakistanis | 74.6 /100 | #136 | Good 5.4% |
| Immigrants | Canada | 74.6 /100 | #137 | Good 5.4% |
| Serbians | 72.9 /100 | #138 | Good 5.4% |
| Lithuanians | 72.4 /100 | #139 | Good 5.4% |
| Immigrants | North America | 72.2 /100 | #140 | Good 5.4% |
| Immigrants | Europe | 72.1 /100 | #141 | Good 5.4% |
| Immigrants | Greece | 72.0 /100 | #142 | Good 5.4% |
| Russians | 71.1 /100 | #143 | Good 5.4% |
| Immigrants | Russia | 71.0 /100 | #144 | Good 5.4% |
| Syrians | 70.3 /100 | #145 | Good 5.4% |
| Celtics | 70.2 /100 | #146 | Good 5.4% |
| Ukrainians | 69.2 /100 | #147 | Good 5.4% |