Laotian vs Immigrants from Kenya Unemployment Among Ages 30 to 34 years
COMPARE
Laotian
Immigrants from Kenya
Unemployment Among Ages 30 to 34 years
Unemployment Among Ages 30 to 34 years Comparison
Laotians
Immigrants from Kenya
5.2%
UNEMPLOYMENT AMONG AGES 30 TO 34 YEARS
92.4/ 100
METRIC RATING
93rd/ 347
METRIC RANK
5.2%
UNEMPLOYMENT AMONG AGES 30 TO 34 YEARS
93.3/ 100
METRIC RATING
88th/ 347
METRIC RANK
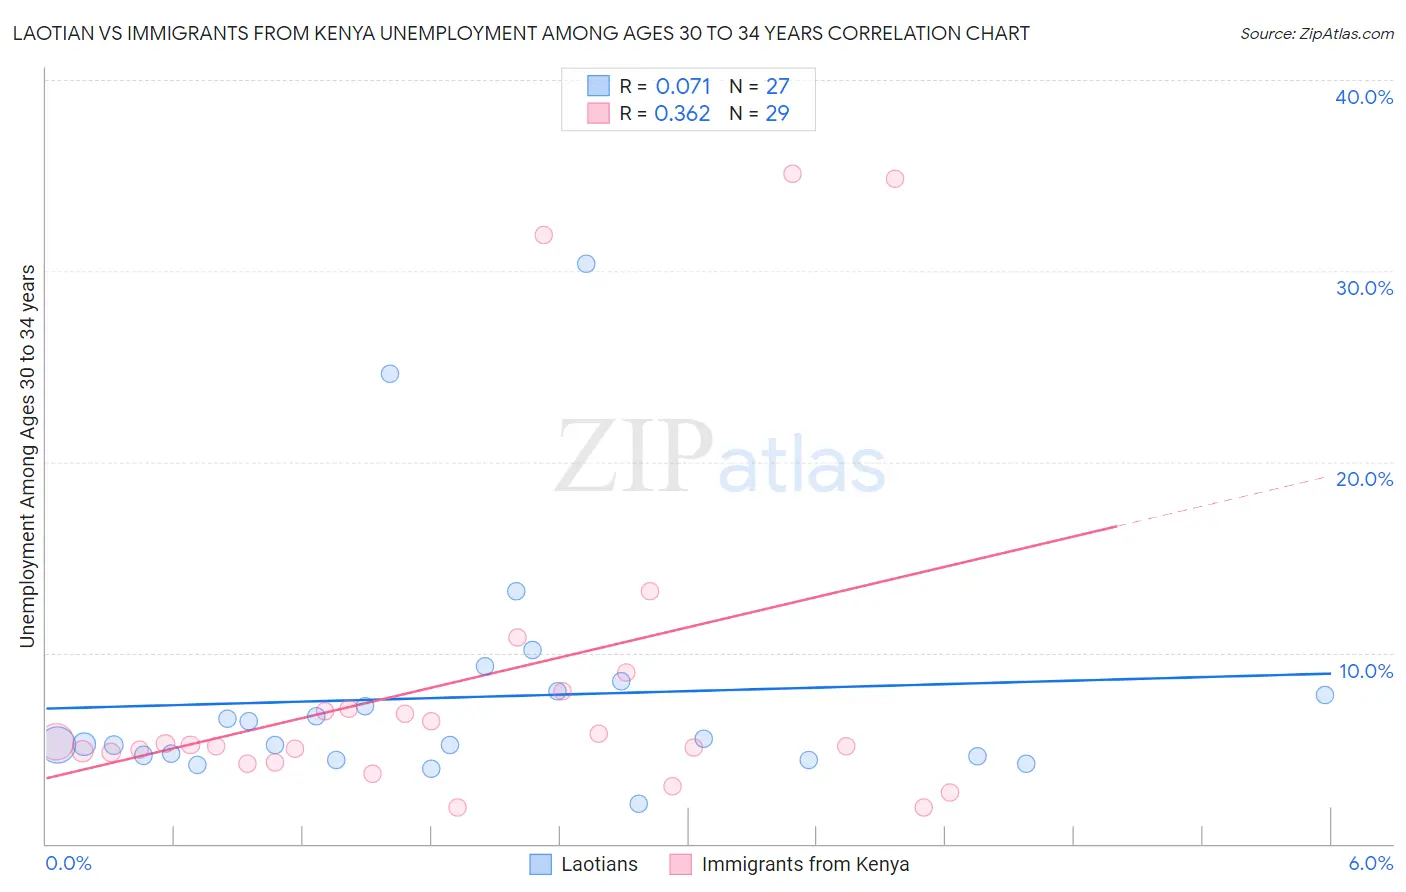
Laotian vs Immigrants from Kenya Unemployment Among Ages 30 to 34 years Correlation Chart
The statistical analysis conducted on geographies consisting of 218,386,667 people shows a slight positive correlation between the proportion of Laotians and unemployment rate among population between the ages 30 and 34 in the United States with a correlation coefficient (R) of 0.071 and weighted average of 5.2%. Similarly, the statistical analysis conducted on geographies consisting of 212,957,240 people shows a mild positive correlation between the proportion of Immigrants from Kenya and unemployment rate among population between the ages 30 and 34 in the United States with a correlation coefficient (R) of 0.362 and weighted average of 5.2%, a difference of 0.27%.
Unemployment Among Ages 30 to 34 years Correlation Summary
| Measurement | Laotian | Immigrants from Kenya |
| Minimum | 2.1% | 1.9% |
| Maximum | 30.4% | 35.1% |
| Range | 28.3% | 33.2% |
| Mean | 7.7% | 8.5% |
| Median | 5.2% | 5.2% |
| Interquartile 25% (IQ1) | 4.6% | 4.5% |
| Interquartile 75% (IQ3) | 8.0% | 7.5% |
| Interquartile Range (IQR) | 3.4% | 3.0% |
| Standard Deviation (Sample) | 6.2% | 9.1% |
| Standard Deviation (Population) | 6.1% | 9.0% |
Demographics Similar to Laotians and Immigrants from Kenya by Unemployment Among Ages 30 to 34 years
In terms of unemployment among ages 30 to 34 years, the demographic groups most similar to Laotians are Maltese (5.2%, a difference of 0.0%), Immigrants from Argentina (5.2%, a difference of 0.050%), Iraqi (5.2%, a difference of 0.070%), Kenyan (5.2%, a difference of 0.070%), and Immigrants from Romania (5.2%, a difference of 0.12%). Similarly, the demographic groups most similar to Immigrants from Kenya are Immigrants from Sweden (5.2%, a difference of 0.010%), Immigrants from Australia (5.2%, a difference of 0.040%), Bhutanese (5.2%, a difference of 0.040%), Immigrants from Romania (5.2%, a difference of 0.15%), and Immigrants from Egypt (5.2%, a difference of 0.16%).
| Demographics | Rating | Rank | Unemployment Among Ages 30 to 34 years |
| Immigrants | Indonesia | 94.7 /100 | #80 | Exceptional 5.2% |
| Chileans | 94.4 /100 | #81 | Exceptional 5.2% |
| Immigrants | Latvia | 94.2 /100 | #82 | Exceptional 5.2% |
| Immigrants | Korea | 94.1 /100 | #83 | Exceptional 5.2% |
| Immigrants | Uganda | 94.0 /100 | #84 | Exceptional 5.2% |
| Immigrants | Egypt | 93.9 /100 | #85 | Exceptional 5.2% |
| Immigrants | Australia | 93.5 /100 | #86 | Exceptional 5.2% |
| Bhutanese | 93.5 /100 | #87 | Exceptional 5.2% |
| Immigrants | Kenya | 93.3 /100 | #88 | Exceptional 5.2% |
| Immigrants | Sweden | 93.3 /100 | #89 | Exceptional 5.2% |
| Immigrants | Romania | 92.8 /100 | #90 | Exceptional 5.2% |
| Iraqis | 92.6 /100 | #91 | Exceptional 5.2% |
| Immigrants | Argentina | 92.5 /100 | #92 | Exceptional 5.2% |
| Laotians | 92.4 /100 | #93 | Exceptional 5.2% |
| Maltese | 92.3 /100 | #94 | Exceptional 5.2% |
| Kenyans | 92.1 /100 | #95 | Exceptional 5.2% |
| Mongolians | 91.7 /100 | #96 | Exceptional 5.2% |
| Europeans | 91.7 /100 | #97 | Exceptional 5.2% |
| Immigrants | North Macedonia | 90.9 /100 | #98 | Exceptional 5.2% |
| Immigrants | Ireland | 90.6 /100 | #99 | Exceptional 5.2% |
| Immigrants | Czechoslovakia | 89.5 /100 | #100 | Excellent 5.3% |