Immigrants from Portugal vs Immigrants from Kenya Unemployment Among Ages 30 to 34 years
COMPARE
Immigrants from Portugal
Immigrants from Kenya
Unemployment Among Ages 30 to 34 years
Unemployment Among Ages 30 to 34 years Comparison
Immigrants from Portugal
Immigrants from Kenya
6.1%
UNEMPLOYMENT AMONG AGES 30 TO 34 YEARS
0.1/ 100
METRIC RATING
255th/ 347
METRIC RANK
5.2%
UNEMPLOYMENT AMONG AGES 30 TO 34 YEARS
93.3/ 100
METRIC RATING
88th/ 347
METRIC RANK
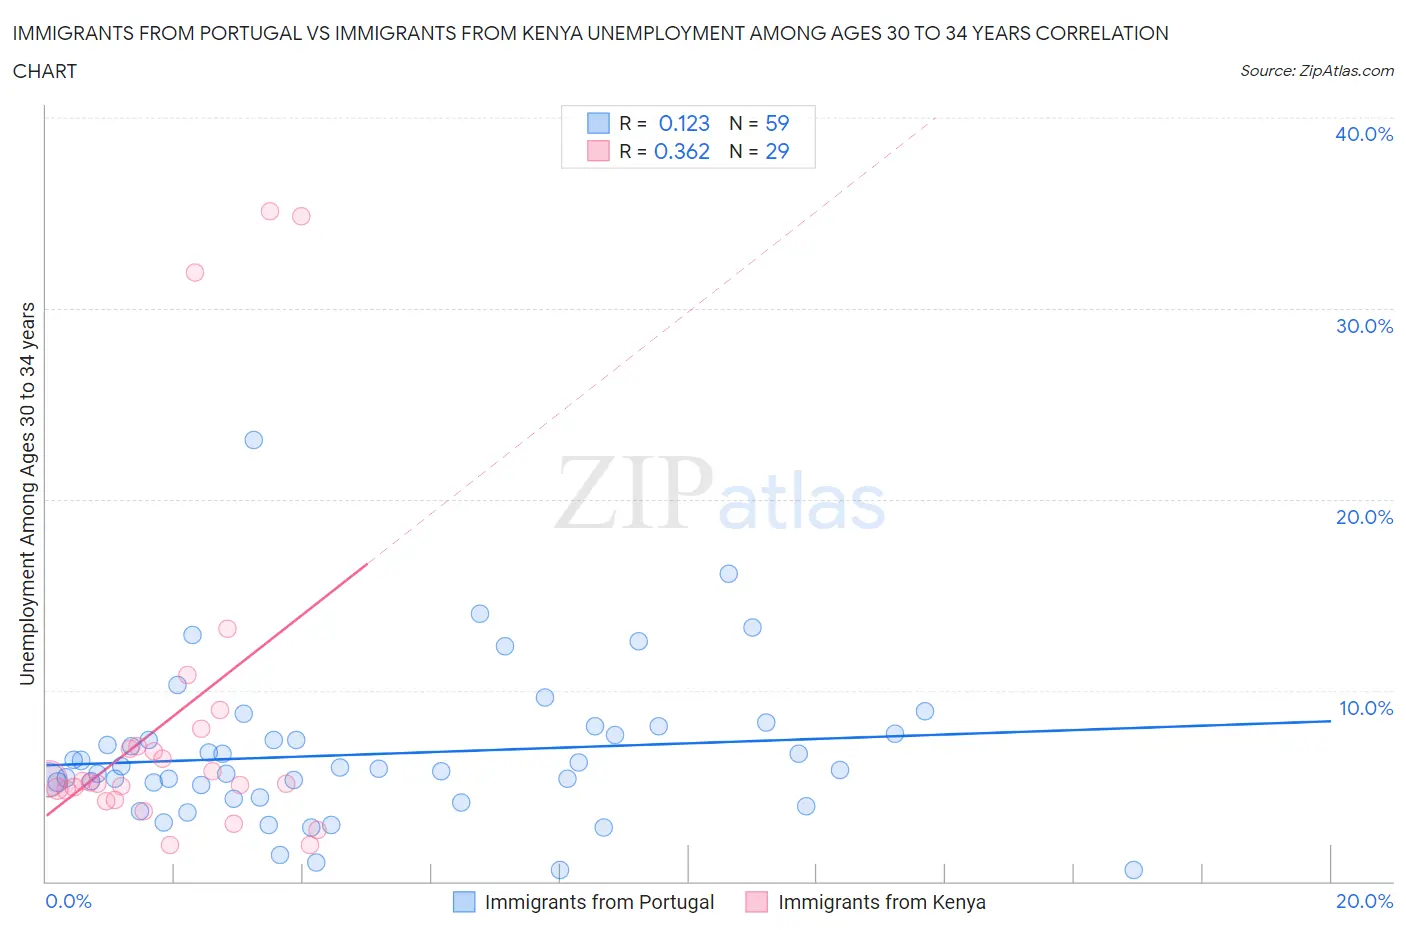
Immigrants from Portugal vs Immigrants from Kenya Unemployment Among Ages 30 to 34 years Correlation Chart
The statistical analysis conducted on geographies consisting of 168,958,290 people shows a poor positive correlation between the proportion of Immigrants from Portugal and unemployment rate among population between the ages 30 and 34 in the United States with a correlation coefficient (R) of 0.123 and weighted average of 6.1%. Similarly, the statistical analysis conducted on geographies consisting of 212,957,240 people shows a mild positive correlation between the proportion of Immigrants from Kenya and unemployment rate among population between the ages 30 and 34 in the United States with a correlation coefficient (R) of 0.362 and weighted average of 5.2%, a difference of 17.3%.
Unemployment Among Ages 30 to 34 years Correlation Summary
| Measurement | Immigrants from Portugal | Immigrants from Kenya |
| Minimum | 0.60% | 1.9% |
| Maximum | 23.1% | 35.1% |
| Range | 22.5% | 33.2% |
| Mean | 6.7% | 8.5% |
| Median | 5.9% | 5.2% |
| Interquartile 25% (IQ1) | 4.4% | 4.5% |
| Interquartile 75% (IQ3) | 7.7% | 7.5% |
| Interquartile Range (IQR) | 3.3% | 3.0% |
| Standard Deviation (Sample) | 3.9% | 9.1% |
| Standard Deviation (Population) | 3.9% | 9.0% |
Similar Demographics by Unemployment Among Ages 30 to 34 years
Demographics Similar to Immigrants from Portugal by Unemployment Among Ages 30 to 34 years
In terms of unemployment among ages 30 to 34 years, the demographic groups most similar to Immigrants from Portugal are Immigrants from Ghana (6.1%, a difference of 0.20%), Immigrants from Sierra Leone (6.1%, a difference of 0.24%), Mexican (6.1%, a difference of 0.30%), Armenian (6.1%, a difference of 0.31%), and Haitian (6.1%, a difference of 0.38%).
| Demographics | Rating | Rank | Unemployment Among Ages 30 to 34 years |
| Immigrants | Guatemala | 0.3 /100 | #248 | Tragic 6.0% |
| Hondurans | 0.3 /100 | #249 | Tragic 6.0% |
| Immigrants | Honduras | 0.3 /100 | #250 | Tragic 6.0% |
| Tlingit-Haida | 0.2 /100 | #251 | Tragic 6.0% |
| Potawatomi | 0.2 /100 | #252 | Tragic 6.0% |
| Immigrants | Nonimmigrants | 0.2 /100 | #253 | Tragic 6.1% |
| Armenians | 0.1 /100 | #254 | Tragic 6.1% |
| Immigrants | Portugal | 0.1 /100 | #255 | Tragic 6.1% |
| Immigrants | Ghana | 0.1 /100 | #256 | Tragic 6.1% |
| Immigrants | Sierra Leone | 0.1 /100 | #257 | Tragic 6.1% |
| Mexicans | 0.1 /100 | #258 | Tragic 6.1% |
| Haitians | 0.1 /100 | #259 | Tragic 6.1% |
| Immigrants | Latin America | 0.1 /100 | #260 | Tragic 6.1% |
| Immigrants | Western Africa | 0.1 /100 | #261 | Tragic 6.2% |
| Immigrants | Central America | 0.1 /100 | #262 | Tragic 6.2% |
Demographics Similar to Immigrants from Kenya by Unemployment Among Ages 30 to 34 years
In terms of unemployment among ages 30 to 34 years, the demographic groups most similar to Immigrants from Kenya are Immigrants from Sweden (5.2%, a difference of 0.010%), Immigrants from Australia (5.2%, a difference of 0.040%), Bhutanese (5.2%, a difference of 0.040%), Immigrants from Romania (5.2%, a difference of 0.15%), and Immigrants from Egypt (5.2%, a difference of 0.16%).
| Demographics | Rating | Rank | Unemployment Among Ages 30 to 34 years |
| Chileans | 94.4 /100 | #81 | Exceptional 5.2% |
| Immigrants | Latvia | 94.2 /100 | #82 | Exceptional 5.2% |
| Immigrants | Korea | 94.1 /100 | #83 | Exceptional 5.2% |
| Immigrants | Uganda | 94.0 /100 | #84 | Exceptional 5.2% |
| Immigrants | Egypt | 93.9 /100 | #85 | Exceptional 5.2% |
| Immigrants | Australia | 93.5 /100 | #86 | Exceptional 5.2% |
| Bhutanese | 93.5 /100 | #87 | Exceptional 5.2% |
| Immigrants | Kenya | 93.3 /100 | #88 | Exceptional 5.2% |
| Immigrants | Sweden | 93.3 /100 | #89 | Exceptional 5.2% |
| Immigrants | Romania | 92.8 /100 | #90 | Exceptional 5.2% |
| Iraqis | 92.6 /100 | #91 | Exceptional 5.2% |
| Immigrants | Argentina | 92.5 /100 | #92 | Exceptional 5.2% |
| Laotians | 92.4 /100 | #93 | Exceptional 5.2% |
| Maltese | 92.3 /100 | #94 | Exceptional 5.2% |
| Kenyans | 92.1 /100 | #95 | Exceptional 5.2% |