Irish vs Immigrants from China Male Unemployment
COMPARE
Irish
Immigrants from China
Male Unemployment
Male Unemployment Comparison
Irish
Immigrants from China
5.0%
MALE UNEMPLOYMENT
98.8/ 100
METRIC RATING
52nd/ 347
METRIC RANK
5.2%
MALE UNEMPLOYMENT
70.6/ 100
METRIC RATING
161st/ 347
METRIC RANK
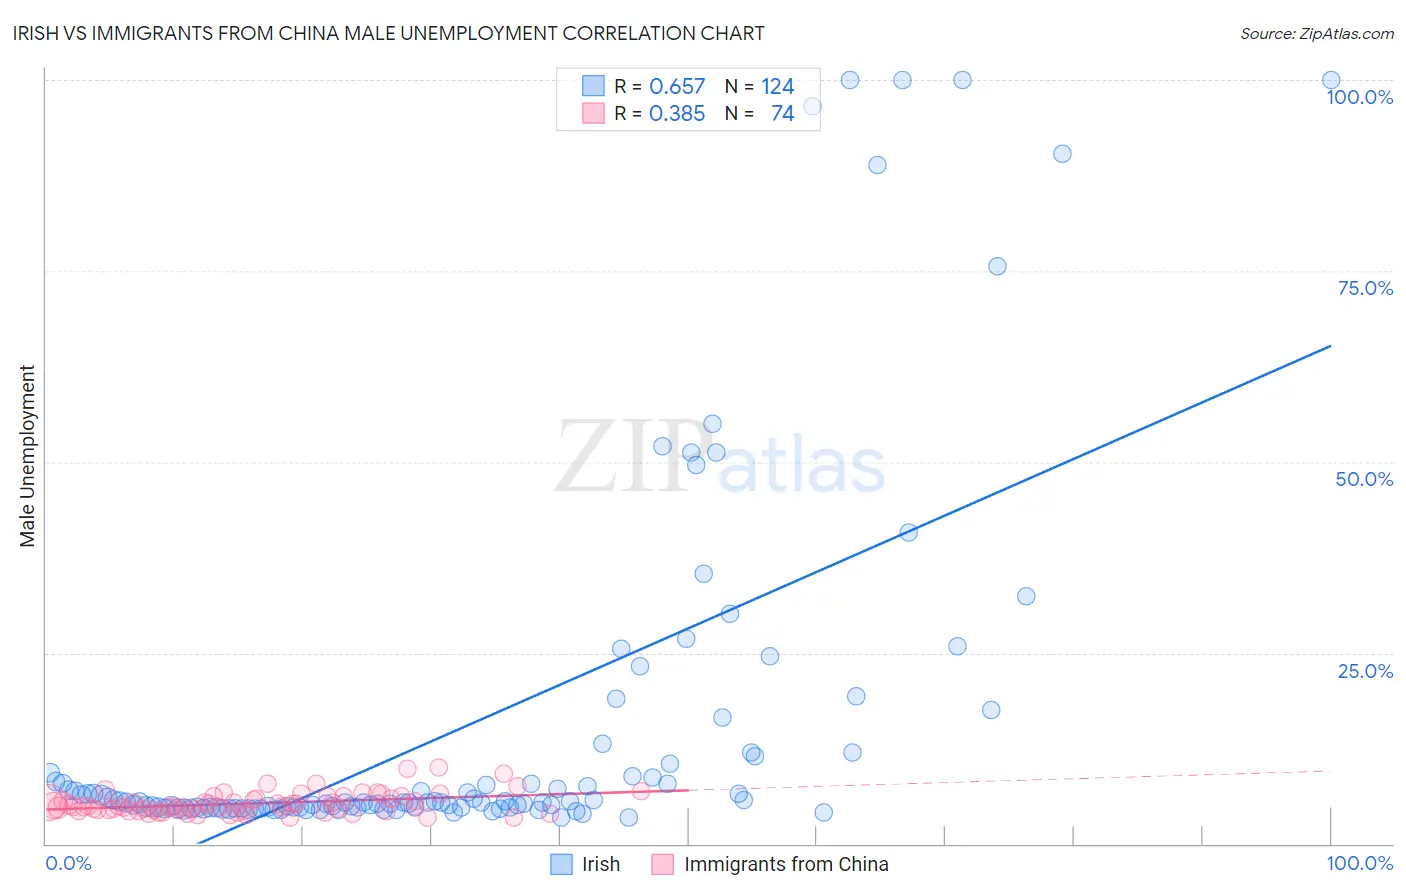
Irish vs Immigrants from China Male Unemployment Correlation Chart
The statistical analysis conducted on geographies consisting of 566,974,673 people shows a significant positive correlation between the proportion of Irish and unemployment rate among males in the United States with a correlation coefficient (R) of 0.657 and weighted average of 5.0%. Similarly, the statistical analysis conducted on geographies consisting of 454,688,998 people shows a mild positive correlation between the proportion of Immigrants from China and unemployment rate among males in the United States with a correlation coefficient (R) of 0.385 and weighted average of 5.2%, a difference of 5.6%.
Male Unemployment Correlation Summary
| Measurement | Irish | Immigrants from China |
| Minimum | 3.4% | 3.4% |
| Maximum | 100.0% | 10.0% |
| Range | 96.6% | 6.6% |
| Mean | 15.4% | 5.3% |
| Median | 5.4% | 4.9% |
| Interquartile 25% (IQ1) | 4.7% | 4.3% |
| Interquartile 75% (IQ3) | 9.9% | 5.9% |
| Interquartile Range (IQR) | 5.2% | 1.5% |
| Standard Deviation (Sample) | 23.5% | 1.4% |
| Standard Deviation (Population) | 23.4% | 1.4% |
Similar Demographics by Male Unemployment
Demographics Similar to Irish by Male Unemployment
In terms of male unemployment, the demographic groups most similar to Irish are Slovene (5.0%, a difference of 0.020%), Polish (4.9%, a difference of 0.060%), Croatian (4.9%, a difference of 0.060%), Jordanian (5.0%, a difference of 0.060%), and Immigrants from Scotland (4.9%, a difference of 0.080%).
| Demographics | Rating | Rank | Male Unemployment |
| Immigrants | Zimbabwe | 99.0 /100 | #45 | Exceptional 4.9% |
| Bhutanese | 98.9 /100 | #46 | Exceptional 4.9% |
| Austrians | 98.9 /100 | #47 | Exceptional 4.9% |
| Immigrants | Scotland | 98.9 /100 | #48 | Exceptional 4.9% |
| Poles | 98.9 /100 | #49 | Exceptional 4.9% |
| Croatians | 98.9 /100 | #50 | Exceptional 4.9% |
| Slovenes | 98.8 /100 | #51 | Exceptional 5.0% |
| Irish | 98.8 /100 | #52 | Exceptional 5.0% |
| Jordanians | 98.8 /100 | #53 | Exceptional 5.0% |
| Yugoslavians | 98.7 /100 | #54 | Exceptional 5.0% |
| Czechoslovakians | 98.7 /100 | #55 | Exceptional 5.0% |
| Immigrants | Bulgaria | 98.7 /100 | #56 | Exceptional 5.0% |
| Turks | 98.5 /100 | #57 | Exceptional 5.0% |
| Lithuanians | 98.5 /100 | #58 | Exceptional 5.0% |
| Immigrants | Netherlands | 98.3 /100 | #59 | Exceptional 5.0% |
Demographics Similar to Immigrants from China by Male Unemployment
In terms of male unemployment, the demographic groups most similar to Immigrants from China are Immigrants from Norway (5.2%, a difference of 0.030%), Indonesian (5.2%, a difference of 0.040%), Immigrants from Indonesia (5.2%, a difference of 0.070%), Immigrants from Northern Africa (5.2%, a difference of 0.12%), and American (5.2%, a difference of 0.15%).
| Demographics | Rating | Rank | Male Unemployment |
| Laotians | 73.8 /100 | #154 | Good 5.2% |
| Immigrants | Hungary | 73.4 /100 | #155 | Good 5.2% |
| Americans | 72.7 /100 | #156 | Good 5.2% |
| Immigrants | Northern Africa | 72.3 /100 | #157 | Good 5.2% |
| Immigrants | Indonesia | 71.5 /100 | #158 | Good 5.2% |
| Indonesians | 71.2 /100 | #159 | Good 5.2% |
| Immigrants | Norway | 71.0 /100 | #160 | Good 5.2% |
| Immigrants | China | 70.6 /100 | #161 | Good 5.2% |
| Immigrants | Egypt | 65.9 /100 | #162 | Good 5.2% |
| Immigrants | Hong Kong | 65.7 /100 | #163 | Good 5.2% |
| Afghans | 62.0 /100 | #164 | Good 5.3% |
| South Americans | 60.6 /100 | #165 | Good 5.3% |
| Immigrants | Morocco | 60.2 /100 | #166 | Good 5.3% |
| Immigrants | Vietnam | 58.1 /100 | #167 | Average 5.3% |
| Immigrants | Ireland | 57.7 /100 | #168 | Average 5.3% |