Inupiat vs Immigrants from Croatia Unemployment Among Ages 16 to 19 years
COMPARE
Inupiat
Immigrants from Croatia
Unemployment Among Ages 16 to 19 years
Unemployment Among Ages 16 to 19 years Comparison
Inupiat
Immigrants from Croatia
28.1%
UNEMPLOYMENT AMONG AGES 16 TO 19 YEARS
0.0/ 100
METRIC RATING
342nd/ 347
METRIC RANK
17.3%
UNEMPLOYMENT AMONG AGES 16 TO 19 YEARS
80.8/ 100
METRIC RATING
140th/ 347
METRIC RANK
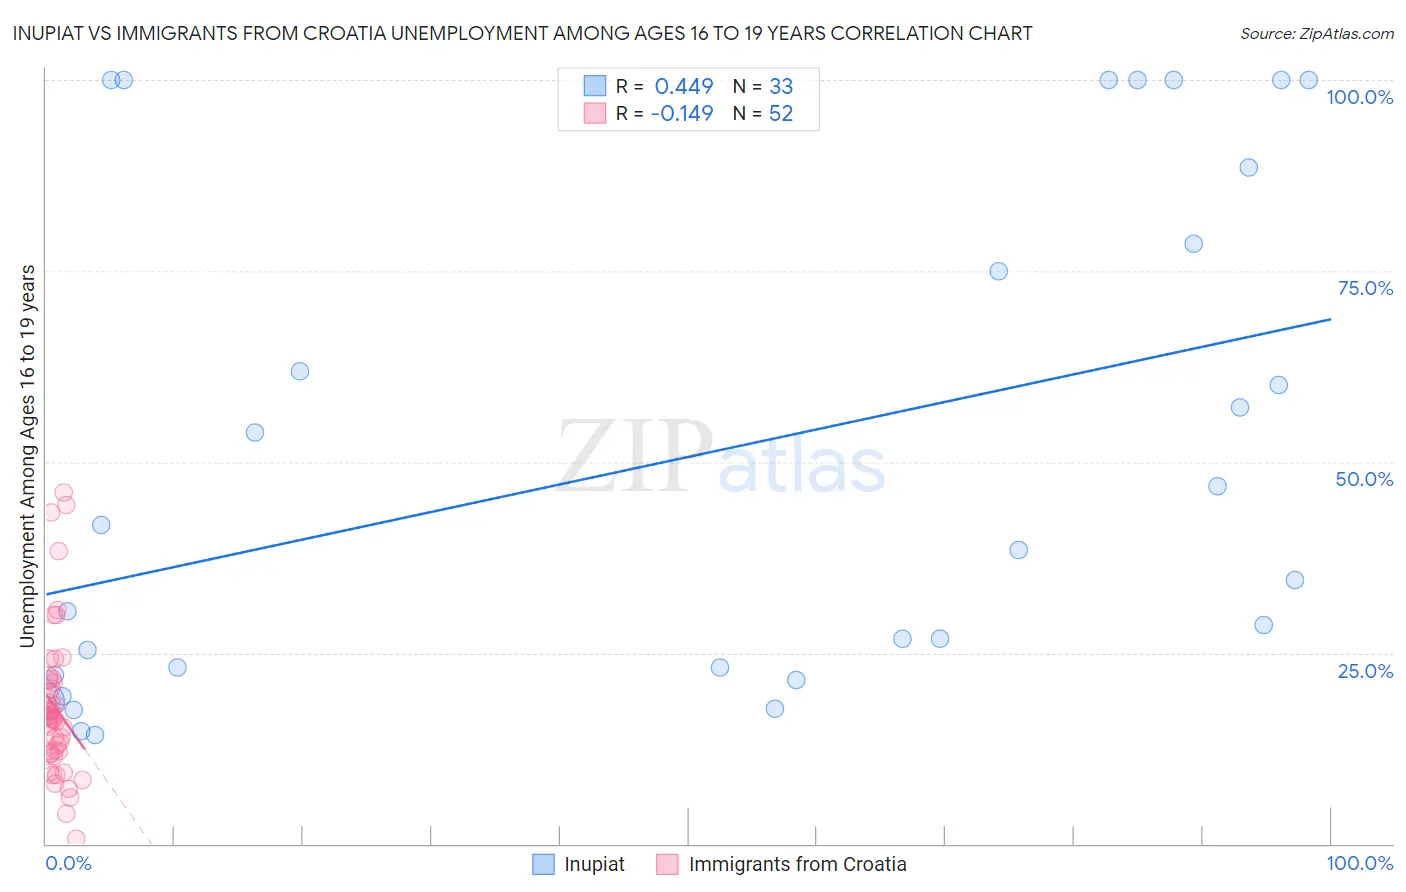
Inupiat vs Immigrants from Croatia Unemployment Among Ages 16 to 19 years Correlation Chart
The statistical analysis conducted on geographies consisting of 94,709,407 people shows a moderate positive correlation between the proportion of Inupiat and unemployment rate among population between the ages 16 and 19 in the United States with a correlation coefficient (R) of 0.449 and weighted average of 28.1%. Similarly, the statistical analysis conducted on geographies consisting of 128,979,737 people shows a poor negative correlation between the proportion of Immigrants from Croatia and unemployment rate among population between the ages 16 and 19 in the United States with a correlation coefficient (R) of -0.149 and weighted average of 17.3%, a difference of 62.4%.
Unemployment Among Ages 16 to 19 years Correlation Summary
| Measurement | Inupiat | Immigrants from Croatia |
| Minimum | 14.3% | 0.60% |
| Maximum | 100.0% | 45.9% |
| Range | 85.7% | 45.3% |
| Mean | 50.5% | 17.8% |
| Median | 38.5% | 16.4% |
| Interquartile 25% (IQ1) | 22.5% | 12.0% |
| Interquartile 75% (IQ3) | 83.6% | 21.3% |
| Interquartile Range (IQR) | 61.1% | 9.4% |
| Standard Deviation (Sample) | 32.3% | 9.7% |
| Standard Deviation (Population) | 31.8% | 9.6% |
Similar Demographics by Unemployment Among Ages 16 to 19 years
Demographics Similar to Inupiat by Unemployment Among Ages 16 to 19 years
In terms of unemployment among ages 16 to 19 years, the demographic groups most similar to Inupiat are Puerto Rican (27.5%, a difference of 2.0%), Navajo (29.0%, a difference of 3.5%), Colville (29.7%, a difference of 5.8%), Crow (26.2%, a difference of 6.9%), and Immigrants from Grenada (25.7%, a difference of 9.0%).
| Demographics | Rating | Rank | Unemployment Among Ages 16 to 19 years |
| Paiute | 0.0 /100 | #333 | Tragic 24.4% |
| Guyanese | 0.0 /100 | #334 | Tragic 24.8% |
| Arapaho | 0.0 /100 | #335 | Tragic 25.2% |
| Kiowa | 0.0 /100 | #336 | Tragic 25.2% |
| Immigrants | Guyana | 0.0 /100 | #337 | Tragic 25.5% |
| Immigrants | St. Vincent and the Grenadines | 0.0 /100 | #338 | Tragic 25.7% |
| Immigrants | Grenada | 0.0 /100 | #339 | Tragic 25.7% |
| Crow | 0.0 /100 | #340 | Tragic 26.2% |
| Puerto Ricans | 0.0 /100 | #341 | Tragic 27.5% |
| Inupiat | 0.0 /100 | #342 | Tragic 28.1% |
| Navajo | 0.0 /100 | #343 | Tragic 29.0% |
| Colville | 0.0 /100 | #344 | Tragic 29.7% |
| Hopi | 0.0 /100 | #345 | Tragic 30.7% |
| Yuman | 0.0 /100 | #346 | Tragic 37.4% |
| Yup'ik | 0.0 /100 | #347 | Tragic 41.0% |
Demographics Similar to Immigrants from Croatia by Unemployment Among Ages 16 to 19 years
In terms of unemployment among ages 16 to 19 years, the demographic groups most similar to Immigrants from Croatia are Basque (17.3%, a difference of 0.010%), Immigrants from Eritrea (17.3%, a difference of 0.020%), Bolivian (17.3%, a difference of 0.090%), Spanish (17.3%, a difference of 0.12%), and Immigrants from Egypt (17.3%, a difference of 0.13%).
| Demographics | Rating | Rank | Unemployment Among Ages 16 to 19 years |
| Laotians | 83.9 /100 | #133 | Excellent 17.2% |
| Potawatomi | 83.8 /100 | #134 | Excellent 17.2% |
| Samoans | 83.7 /100 | #135 | Excellent 17.2% |
| Immigrants | Oceania | 83.1 /100 | #136 | Excellent 17.2% |
| Immigrants | Malaysia | 82.8 /100 | #137 | Excellent 17.2% |
| Bolivians | 81.9 /100 | #138 | Excellent 17.3% |
| Immigrants | Eritrea | 81.1 /100 | #139 | Excellent 17.3% |
| Immigrants | Croatia | 80.8 /100 | #140 | Excellent 17.3% |
| Basques | 80.7 /100 | #141 | Excellent 17.3% |
| Spanish | 79.3 /100 | #142 | Good 17.3% |
| Immigrants | Egypt | 79.1 /100 | #143 | Good 17.3% |
| Immigrants | England | 78.9 /100 | #144 | Good 17.3% |
| Indians (Asian) | 77.6 /100 | #145 | Good 17.3% |
| Turks | 77.1 /100 | #146 | Good 17.3% |
| Tsimshian | 76.0 /100 | #147 | Good 17.3% |