Inupiat vs Eastern European Unemployment Among Ages 16 to 19 years
COMPARE
Inupiat
Eastern European
Unemployment Among Ages 16 to 19 years
Unemployment Among Ages 16 to 19 years Comparison
Inupiat
Eastern Europeans
28.1%
UNEMPLOYMENT AMONG AGES 16 TO 19 YEARS
0.0/ 100
METRIC RATING
342nd/ 347
METRIC RANK
17.6%
UNEMPLOYMENT AMONG AGES 16 TO 19 YEARS
44.3/ 100
METRIC RATING
184th/ 347
METRIC RANK
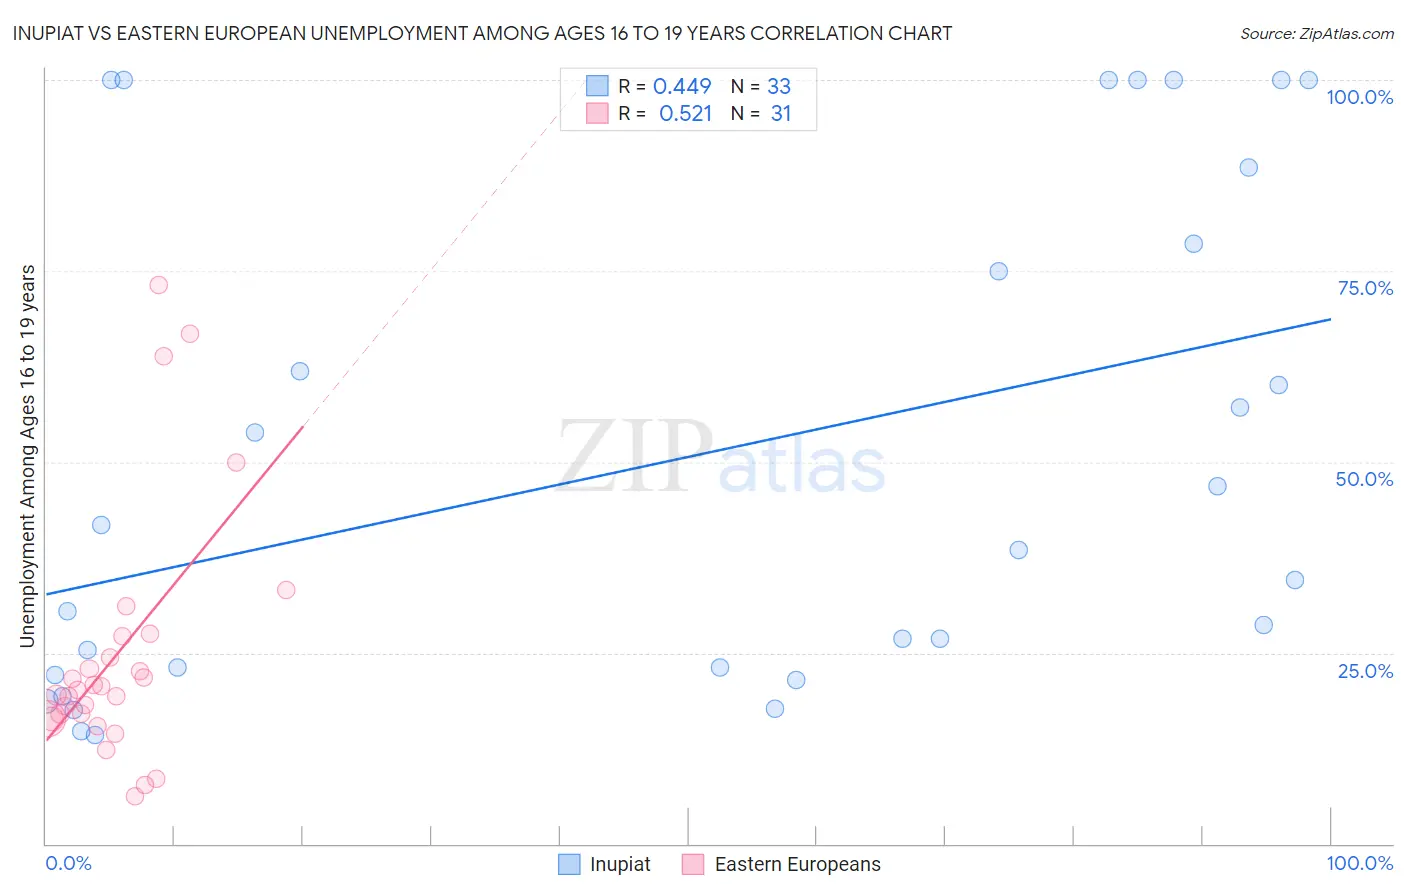
Inupiat vs Eastern European Unemployment Among Ages 16 to 19 years Correlation Chart
The statistical analysis conducted on geographies consisting of 94,709,407 people shows a moderate positive correlation between the proportion of Inupiat and unemployment rate among population between the ages 16 and 19 in the United States with a correlation coefficient (R) of 0.449 and weighted average of 28.1%. Similarly, the statistical analysis conducted on geographies consisting of 427,327,922 people shows a substantial positive correlation between the proportion of Eastern Europeans and unemployment rate among population between the ages 16 and 19 in the United States with a correlation coefficient (R) of 0.521 and weighted average of 17.6%, a difference of 59.2%.
Unemployment Among Ages 16 to 19 years Correlation Summary
| Measurement | Inupiat | Eastern European |
| Minimum | 14.3% | 6.2% |
| Maximum | 100.0% | 73.2% |
| Range | 85.7% | 67.0% |
| Mean | 50.5% | 24.9% |
| Median | 38.5% | 20.1% |
| Interquartile 25% (IQ1) | 22.5% | 16.4% |
| Interquartile 75% (IQ3) | 83.6% | 27.2% |
| Interquartile Range (IQR) | 61.1% | 10.8% |
| Standard Deviation (Sample) | 32.3% | 16.5% |
| Standard Deviation (Population) | 31.8% | 16.2% |
Similar Demographics by Unemployment Among Ages 16 to 19 years
Demographics Similar to Inupiat by Unemployment Among Ages 16 to 19 years
In terms of unemployment among ages 16 to 19 years, the demographic groups most similar to Inupiat are Puerto Rican (27.5%, a difference of 2.0%), Navajo (29.0%, a difference of 3.5%), Colville (29.7%, a difference of 5.8%), Crow (26.2%, a difference of 6.9%), and Immigrants from Grenada (25.7%, a difference of 9.0%).
| Demographics | Rating | Rank | Unemployment Among Ages 16 to 19 years |
| Paiute | 0.0 /100 | #333 | Tragic 24.4% |
| Guyanese | 0.0 /100 | #334 | Tragic 24.8% |
| Arapaho | 0.0 /100 | #335 | Tragic 25.2% |
| Kiowa | 0.0 /100 | #336 | Tragic 25.2% |
| Immigrants | Guyana | 0.0 /100 | #337 | Tragic 25.5% |
| Immigrants | St. Vincent and the Grenadines | 0.0 /100 | #338 | Tragic 25.7% |
| Immigrants | Grenada | 0.0 /100 | #339 | Tragic 25.7% |
| Crow | 0.0 /100 | #340 | Tragic 26.2% |
| Puerto Ricans | 0.0 /100 | #341 | Tragic 27.5% |
| Inupiat | 0.0 /100 | #342 | Tragic 28.1% |
| Navajo | 0.0 /100 | #343 | Tragic 29.0% |
| Colville | 0.0 /100 | #344 | Tragic 29.7% |
| Hopi | 0.0 /100 | #345 | Tragic 30.7% |
| Yuman | 0.0 /100 | #346 | Tragic 37.4% |
| Yup'ik | 0.0 /100 | #347 | Tragic 41.0% |
Demographics Similar to Eastern Europeans by Unemployment Among Ages 16 to 19 years
In terms of unemployment among ages 16 to 19 years, the demographic groups most similar to Eastern Europeans are Immigrants from Uruguay (17.6%, a difference of 0.020%), Iroquois (17.6%, a difference of 0.040%), Russian (17.6%, a difference of 0.050%), Japanese (17.6%, a difference of 0.050%), and Immigrants from Turkey (17.6%, a difference of 0.060%).
| Demographics | Rating | Rank | Unemployment Among Ages 16 to 19 years |
| Bermudans | 48.7 /100 | #177 | Average 17.6% |
| Celtics | 48.7 /100 | #178 | Average 17.6% |
| Americans | 47.4 /100 | #179 | Average 17.6% |
| Spaniards | 47.1 /100 | #180 | Average 17.6% |
| Immigrants | Turkey | 45.6 /100 | #181 | Average 17.6% |
| Russians | 45.2 /100 | #182 | Average 17.6% |
| Immigrants | Uruguay | 44.6 /100 | #183 | Average 17.6% |
| Eastern Europeans | 44.3 /100 | #184 | Average 17.6% |
| Iroquois | 43.4 /100 | #185 | Average 17.6% |
| Japanese | 43.2 /100 | #186 | Average 17.6% |
| Immigrants | Micronesia | 42.4 /100 | #187 | Average 17.6% |
| Immigrants | Nicaragua | 42.2 /100 | #188 | Average 17.6% |
| Immigrants | Europe | 41.8 /100 | #189 | Average 17.6% |
| Marshallese | 41.7 /100 | #190 | Average 17.6% |
| Immigrants | Costa Rica | 41.3 /100 | #191 | Average 17.6% |