Inupiat vs Immigrants from Bangladesh Unemployment Among Women with Children Under 18 years
COMPARE
Inupiat
Immigrants from Bangladesh
Unemployment Among Women with Children Under 18 years
Unemployment Among Women with Children Under 18 years Comparison
Inupiat
Immigrants from Bangladesh
9.6%
UNEMPLOYMENT AMONG WOMEN WITH CHILDREN UNDER 18 YEARS
0.0/ 100
METRIC RATING
344th/ 347
METRIC RANK
6.4%
UNEMPLOYMENT AMONG WOMEN WITH CHILDREN UNDER 18 YEARS
0.0/ 100
METRIC RATING
293rd/ 347
METRIC RANK
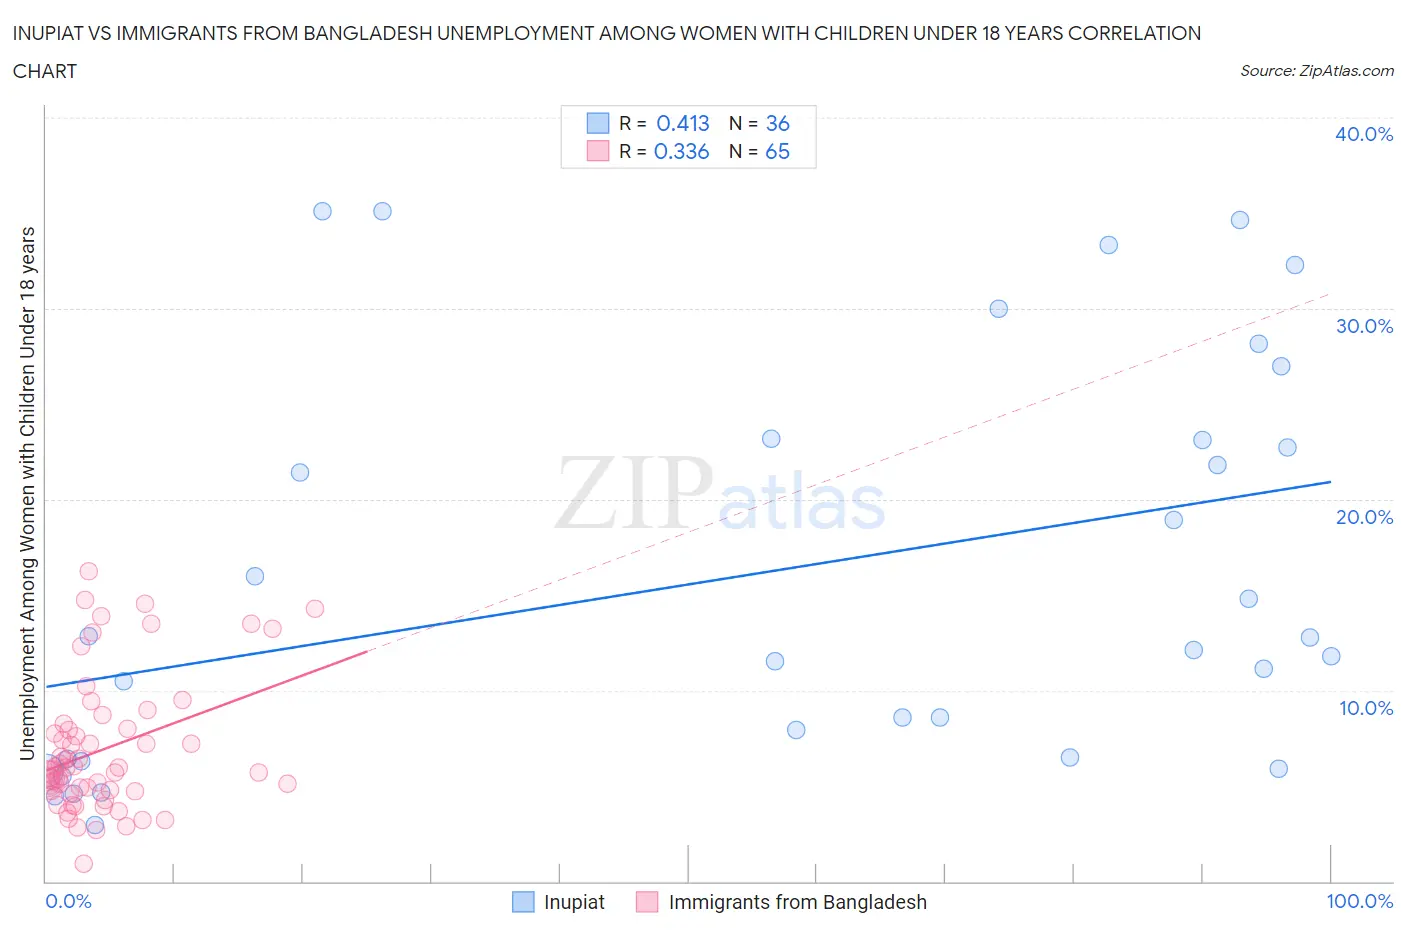
Inupiat vs Immigrants from Bangladesh Unemployment Among Women with Children Under 18 years Correlation Chart
The statistical analysis conducted on geographies consisting of 94,720,534 people shows a moderate positive correlation between the proportion of Inupiat and unemployment rate among women with children under the age of 18 in the United States with a correlation coefficient (R) of 0.413 and weighted average of 9.6%. Similarly, the statistical analysis conducted on geographies consisting of 201,017,496 people shows a mild positive correlation between the proportion of Immigrants from Bangladesh and unemployment rate among women with children under the age of 18 in the United States with a correlation coefficient (R) of 0.336 and weighted average of 6.4%, a difference of 50.2%.
Unemployment Among Women with Children Under 18 years Correlation Summary
| Measurement | Inupiat | Immigrants from Bangladesh |
| Minimum | 2.9% | 0.90% |
| Maximum | 35.1% | 16.2% |
| Range | 32.2% | 15.3% |
| Mean | 16.1% | 6.9% |
| Median | 12.4% | 6.0% |
| Interquartile 25% (IQ1) | 6.5% | 4.7% |
| Interquartile 75% (IQ3) | 23.1% | 8.1% |
| Interquartile Range (IQR) | 16.7% | 3.4% |
| Standard Deviation (Sample) | 10.4% | 3.5% |
| Standard Deviation (Population) | 10.3% | 3.5% |
Similar Demographics by Unemployment Among Women with Children Under 18 years
Demographics Similar to Inupiat by Unemployment Among Women with Children Under 18 years
In terms of unemployment among women with children under 18 years, the demographic groups most similar to Inupiat are Yuman (9.8%, a difference of 1.9%), Arapaho (9.2%, a difference of 4.2%), Puerto Rican (9.0%, a difference of 6.4%), Tohono O'odham (8.9%, a difference of 8.1%), and Yup'ik (11.0%, a difference of 15.1%).
| Demographics | Rating | Rank | Unemployment Among Women with Children Under 18 years |
| Immigrants | Dominican Republic | 0.0 /100 | #333 | Tragic 7.5% |
| Cheyenne | 0.0 /100 | #334 | Tragic 7.8% |
| Apache | 0.0 /100 | #335 | Tragic 7.9% |
| Sioux | 0.0 /100 | #336 | Tragic 7.9% |
| Yakama | 0.0 /100 | #337 | Tragic 8.1% |
| Immigrants | Yemen | 0.0 /100 | #338 | Tragic 8.2% |
| Navajo | 0.0 /100 | #339 | Tragic 8.2% |
| Crow | 0.0 /100 | #340 | Tragic 8.2% |
| Tohono O'odham | 0.0 /100 | #341 | Tragic 8.9% |
| Puerto Ricans | 0.0 /100 | #342 | Tragic 9.0% |
| Arapaho | 0.0 /100 | #343 | Tragic 9.2% |
| Inupiat | 0.0 /100 | #344 | Tragic 9.6% |
| Yuman | 0.0 /100 | #345 | Tragic 9.8% |
| Yup'ik | 0.0 /100 | #346 | Tragic 11.0% |
| Pima | 0.0 /100 | #347 | Tragic 11.7% |
Demographics Similar to Immigrants from Bangladesh by Unemployment Among Women with Children Under 18 years
In terms of unemployment among women with children under 18 years, the demographic groups most similar to Immigrants from Bangladesh are Mexican (6.4%, a difference of 0.030%), Honduran (6.4%, a difference of 0.030%), Immigrants from Guatemala (6.4%, a difference of 0.090%), Barbadian (6.4%, a difference of 0.11%), and Haitian (6.4%, a difference of 0.13%).
| Demographics | Rating | Rank | Unemployment Among Women with Children Under 18 years |
| Alaskan Athabascans | 0.0 /100 | #286 | Tragic 6.3% |
| Kiowa | 0.0 /100 | #287 | Tragic 6.3% |
| Cree | 0.0 /100 | #288 | Tragic 6.3% |
| Immigrants | Caribbean | 0.0 /100 | #289 | Tragic 6.4% |
| Blackfeet | 0.0 /100 | #290 | Tragic 6.4% |
| Immigrants | Guatemala | 0.0 /100 | #291 | Tragic 6.4% |
| Mexicans | 0.0 /100 | #292 | Tragic 6.4% |
| Immigrants | Bangladesh | 0.0 /100 | #293 | Tragic 6.4% |
| Hondurans | 0.0 /100 | #294 | Tragic 6.4% |
| Barbadians | 0.0 /100 | #295 | Tragic 6.4% |
| Haitians | 0.0 /100 | #296 | Tragic 6.4% |
| Immigrants | Senegal | 0.0 /100 | #297 | Tragic 6.4% |
| Immigrants | Latin America | 0.0 /100 | #298 | Tragic 6.4% |
| Jamaicans | 0.0 /100 | #299 | Tragic 6.4% |
| Immigrants | Jamaica | 0.0 /100 | #300 | Tragic 6.4% |