Immigrants from Korea vs Immigrants from Bangladesh Unemployment Among Women with Children Under 18 years
COMPARE
Immigrants from Korea
Immigrants from Bangladesh
Unemployment Among Women with Children Under 18 years
Unemployment Among Women with Children Under 18 years Comparison
Immigrants from Korea
Immigrants from Bangladesh
5.0%
UNEMPLOYMENT AMONG WOMEN WITH CHILDREN UNDER 18 YEARS
98.7/ 100
METRIC RATING
46th/ 347
METRIC RANK
6.4%
UNEMPLOYMENT AMONG WOMEN WITH CHILDREN UNDER 18 YEARS
0.0/ 100
METRIC RATING
293rd/ 347
METRIC RANK
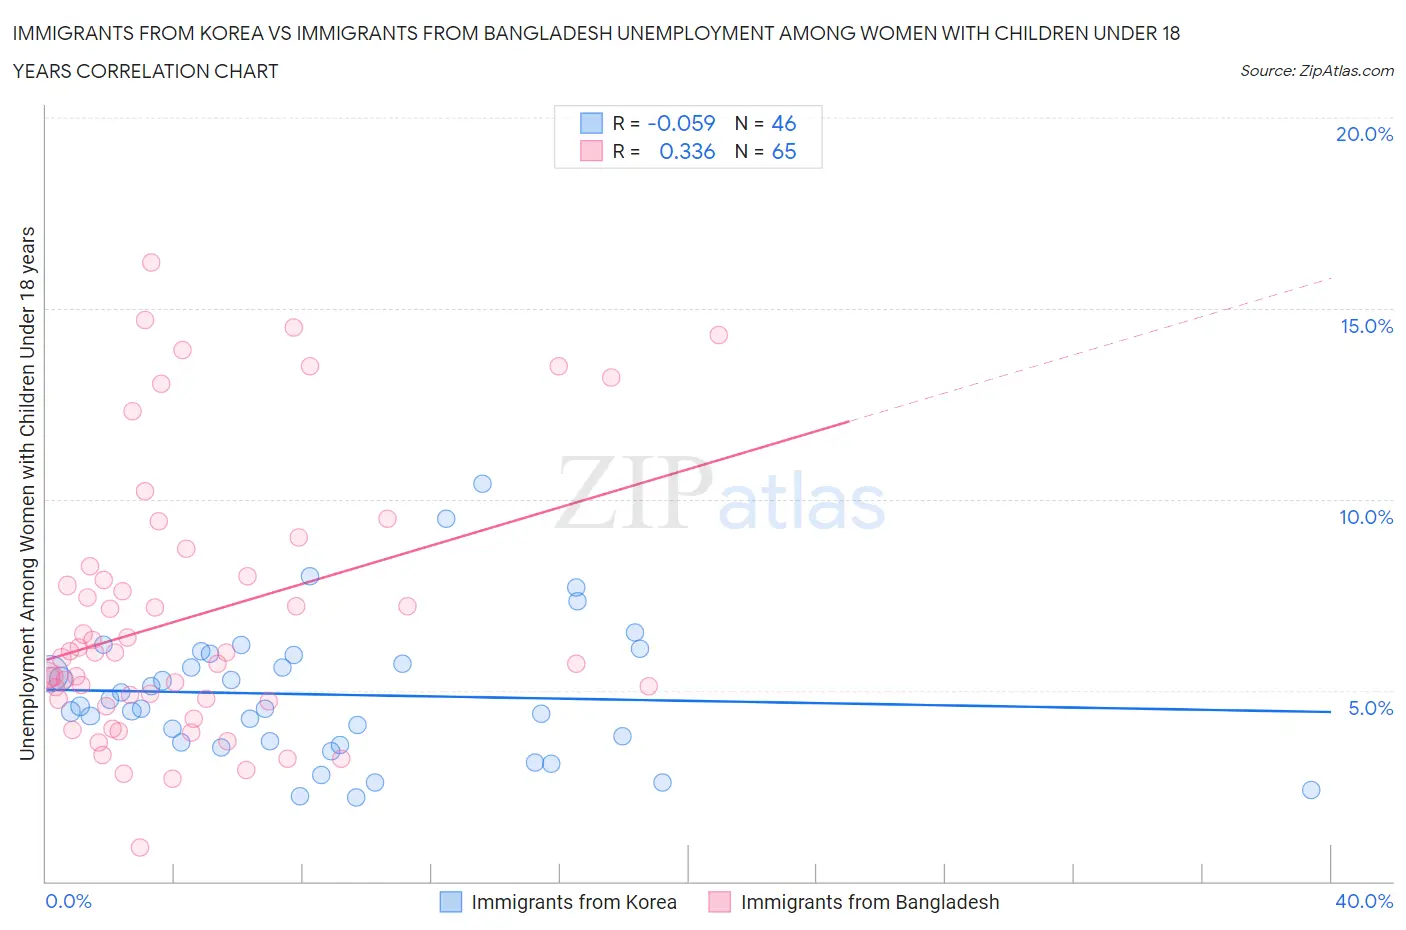
Immigrants from Korea vs Immigrants from Bangladesh Unemployment Among Women with Children Under 18 years Correlation Chart
The statistical analysis conducted on geographies consisting of 398,833,856 people shows a slight negative correlation between the proportion of Immigrants from Korea and unemployment rate among women with children under the age of 18 in the United States with a correlation coefficient (R) of -0.059 and weighted average of 5.0%. Similarly, the statistical analysis conducted on geographies consisting of 201,017,496 people shows a mild positive correlation between the proportion of Immigrants from Bangladesh and unemployment rate among women with children under the age of 18 in the United States with a correlation coefficient (R) of 0.336 and weighted average of 6.4%, a difference of 27.0%.
Unemployment Among Women with Children Under 18 years Correlation Summary
| Measurement | Immigrants from Korea | Immigrants from Bangladesh |
| Minimum | 2.2% | 0.90% |
| Maximum | 10.4% | 16.2% |
| Range | 8.2% | 15.3% |
| Mean | 4.9% | 6.9% |
| Median | 4.5% | 6.0% |
| Interquartile 25% (IQ1) | 3.6% | 4.7% |
| Interquartile 75% (IQ3) | 5.9% | 8.1% |
| Interquartile Range (IQR) | 2.3% | 3.4% |
| Standard Deviation (Sample) | 1.8% | 3.5% |
| Standard Deviation (Population) | 1.8% | 3.5% |
Similar Demographics by Unemployment Among Women with Children Under 18 years
Demographics Similar to Immigrants from Korea by Unemployment Among Women with Children Under 18 years
In terms of unemployment among women with children under 18 years, the demographic groups most similar to Immigrants from Korea are Immigrants from Malaysia (5.0%, a difference of 0.11%), British (5.0%, a difference of 0.13%), Immigrants from Moldova (5.0%, a difference of 0.20%), Northern European (5.0%, a difference of 0.25%), and Turkish (5.0%, a difference of 0.26%).
| Demographics | Rating | Rank | Unemployment Among Women with Children Under 18 years |
| English | 99.1 /100 | #39 | Exceptional 5.0% |
| Greeks | 99.0 /100 | #40 | Exceptional 5.0% |
| Immigrants | Bosnia and Herzegovina | 99.0 /100 | #41 | Exceptional 5.0% |
| Eastern Europeans | 98.9 /100 | #42 | Exceptional 5.0% |
| Turks | 98.9 /100 | #43 | Exceptional 5.0% |
| Immigrants | Moldova | 98.9 /100 | #44 | Exceptional 5.0% |
| Immigrants | Malaysia | 98.8 /100 | #45 | Exceptional 5.0% |
| Immigrants | Korea | 98.7 /100 | #46 | Exceptional 5.0% |
| British | 98.7 /100 | #47 | Exceptional 5.0% |
| Northern Europeans | 98.6 /100 | #48 | Exceptional 5.0% |
| Lithuanians | 98.4 /100 | #49 | Exceptional 5.0% |
| Immigrants | Japan | 98.4 /100 | #50 | Exceptional 5.0% |
| Yugoslavians | 98.3 /100 | #51 | Exceptional 5.1% |
| Immigrants | Nepal | 98.3 /100 | #52 | Exceptional 5.1% |
| Scottish | 98.2 /100 | #53 | Exceptional 5.1% |
Demographics Similar to Immigrants from Bangladesh by Unemployment Among Women with Children Under 18 years
In terms of unemployment among women with children under 18 years, the demographic groups most similar to Immigrants from Bangladesh are Mexican (6.4%, a difference of 0.030%), Honduran (6.4%, a difference of 0.030%), Immigrants from Guatemala (6.4%, a difference of 0.090%), Barbadian (6.4%, a difference of 0.11%), and Haitian (6.4%, a difference of 0.13%).
| Demographics | Rating | Rank | Unemployment Among Women with Children Under 18 years |
| Alaskan Athabascans | 0.0 /100 | #286 | Tragic 6.3% |
| Kiowa | 0.0 /100 | #287 | Tragic 6.3% |
| Cree | 0.0 /100 | #288 | Tragic 6.3% |
| Immigrants | Caribbean | 0.0 /100 | #289 | Tragic 6.4% |
| Blackfeet | 0.0 /100 | #290 | Tragic 6.4% |
| Immigrants | Guatemala | 0.0 /100 | #291 | Tragic 6.4% |
| Mexicans | 0.0 /100 | #292 | Tragic 6.4% |
| Immigrants | Bangladesh | 0.0 /100 | #293 | Tragic 6.4% |
| Hondurans | 0.0 /100 | #294 | Tragic 6.4% |
| Barbadians | 0.0 /100 | #295 | Tragic 6.4% |
| Haitians | 0.0 /100 | #296 | Tragic 6.4% |
| Immigrants | Senegal | 0.0 /100 | #297 | Tragic 6.4% |
| Immigrants | Latin America | 0.0 /100 | #298 | Tragic 6.4% |
| Jamaicans | 0.0 /100 | #299 | Tragic 6.4% |
| Immigrants | Jamaica | 0.0 /100 | #300 | Tragic 6.4% |