Immigrants from Yemen vs Serbian Unemployment Among Ages 30 to 34 years

COMPARE

Immigrants from Yemen
Race
Ancestry
AfghanAfricanAlaska NativeAlaskan AthabascanAlbanianAleutAlsatianAmericanApacheArabArapahoArgentineanArmenianAssyrian/Chaldean/SyriacAustralianAustrianBahamianBangladeshiBarbadianBasqueBelgianBelizeanBermudanBhutaneseBlackfeetBolivianBrazilianBritishBritish West IndianBulgarianBurmeseCajunCambodianCanadianCape VerdeanCarpatho RusynCelticCentral AmericanCentral American IndianCherokeeCheyenneChickasawChileanChineseChippewaChoctawColombianColvilleComancheCosta RicanCreeCreekCroatianCrowCubanCypriotCzechCzechoslovakianDanishDelawareDominicanDutchDutch West IndianEastern EuropeanEcuadorianEgyptianEnglishEstonianEthiopianEuropeanFijianFilipinoFinnishFrenchFrench American IndianFrench CanadianGermanGerman RussianGhanaianGreekGuamanian/ChamorroGuatemalanGuyaneseHaitianHmongHonduranHopiHoumaHungarianIcelanderIndian (Asian)IndonesianInupiatIranianIraqiIrishIroquoisIsraeliItalianJamaicanJapaneseJordanianKenyanKiowaKoreanLaotianLatvianLebaneseLiberianLithuanianLumbeeLuxembourgerMacedonianMalaysianMalteseMarshalleseMenomineeMexicanMexican American IndianMongolianMoroccanNative HawaiianNavajoNepaleseNew ZealanderNicaraguanNigerianNorthern EuropeanNorwegianOkinawanOsageOttawaPaiutePakistaniPalestinianPanamanianParaguayanPennsylvania GermanPeruvianPimaPolishPortuguesePotawatomiPuebloPuerto RicanPuget Sound SalishRomanianRussianSalvadoranSamoanScandinavianScotch-IrishScottishSeminoleSenegaleseShoshoneSierra LeoneanSiouxSlavicSlovakSloveneSomaliSouth AfricanSouth AmericanSouth American IndianSoviet UnionSpaniardSpanishSpanish AmericanSpanish American IndianSri LankanSubsaharan AfricanSudaneseSwedishSwissSyrianTaiwaneseThaiTlingit-HaidaTohono O'OdhamTonganTrinidadian and TobagonianTsimshianTurkishU.S. Virgin IslanderUgandanUkrainianUruguayanUteVenezuelanVietnameseWelshWest IndianYakamaYaquiYugoslavianYumanYup'ikZimbabwean
Immigration
NonimmigrantsImmigrantsAfghanistanAfricaAlbaniaArgentinaArmeniaAsiaAustraliaAustriaBahamasBangladeshBarbadosBelarusBelgiumBelizeBoliviaBosnia and HerzegovinaBrazilBulgariaBurma/MyanmarCabo VerdeCambodiaCameroonCanadaCaribbeanCentral AmericaChileChinaColombiaCongoCosta RicaCroatiaCubaCzechoslovakiaDenmarkDominicaDominican RepublicEastern AfricaEastern AsiaEastern EuropeEcuadorEgyptEl SalvadorEnglandEritreaEthiopiaEuropeFijiFranceGermanyGhanaGreeceGrenadaGuatemalaGuyanaHaitiHondurasHong KongHungaryIndiaIndonesiaIranIraqIrelandIsraelItalyJamaicaJapanJordanKazakhstanKenyaKoreaKuwaitLaosLatin AmericaLatviaLebanonLiberiaLithuaniaMalaysiaMexicoMicronesiaMiddle AfricaMoldovaMoroccoNepalNetherlandsNicaraguaNigeriaNorth AmericaNorth MacedoniaNorthern AfricaNorthern EuropeNorwayOceaniaPakistanPanamaPeruPhilippinesPolandPortugalRomaniaRussiaSaudi ArabiaScotlandSenegalSerbiaSierra LeoneSingaporeSomaliaSouth AfricaSouth AmericaSouth Central AsiaSouth Eastern AsiaSouthern EuropeSpainSri LankaSt. Vincent and the GrenadinesSudanSwedenSwitzerlandSyriaTaiwanThailandTrinidad and TobagoTurkeyUgandaUkraineUruguayUzbekistanVenezuelaVietnamWest IndiesWestern AfricaWestern AsiaWestern EuropeYemenZaireZimbabweAzores
Serbian
Race
Ancestry
AfghanAfricanAlaska NativeAlaskan AthabascanAlbanianAleutAlsatianAmericanApacheArabArapahoArgentineanArmenianAssyrian/Chaldean/SyriacAustralianAustrianBahamianBangladeshiBarbadianBasqueBelgianBelizeanBermudanBhutaneseBlackfeetBolivianBrazilianBritishBritish West IndianBulgarianBurmeseCajunCambodianCanadianCape VerdeanCarpatho RusynCelticCentral AmericanCentral American IndianCherokeeCheyenneChickasawChileanChineseChippewaChoctawColombianColvilleComancheCosta RicanCreeCreekCroatianCrowCubanCypriotCzechCzechoslovakianDanishDelawareDominicanDutchDutch West IndianEastern EuropeanEcuadorianEgyptianEnglishEstonianEthiopianEuropeanFijianFilipinoFinnishFrenchFrench American IndianFrench CanadianGermanGerman RussianGhanaianGreekGuamanian/ChamorroGuatemalanGuyaneseHaitianHmongHonduranHopiHoumaHungarianIcelanderIndian (Asian)IndonesianInupiatIranianIraqiIrishIroquoisIsraeliItalianJamaicanJapaneseJordanianKenyanKiowaKoreanLaotianLatvianLebaneseLiberianLithuanianLumbeeLuxembourgerMacedonianMalaysianMalteseMarshalleseMenomineeMexicanMexican American IndianMongolianMoroccanNative HawaiianNavajoNepaleseNew ZealanderNicaraguanNigerianNorthern EuropeanNorwegianOkinawanOsageOttawaPaiutePakistaniPalestinianPanamanianParaguayanPennsylvania GermanPeruvianPimaPolishPortuguesePotawatomiPuebloPuerto RicanPuget Sound SalishRomanianRussianSalvadoranSamoanScandinavianScotch-IrishScottishSeminoleSenegaleseSerbianShoshoneSierra LeoneanSiouxSlavicSlovakSloveneSomaliSouth AfricanSouth AmericanSouth American IndianSoviet UnionSpaniardSpanishSpanish AmericanSpanish American IndianSri LankanSubsaharan AfricanSudaneseSwedishSwissSyrianTaiwaneseThaiTlingit-HaidaTohono O'OdhamTonganTrinidadian and TobagonianTsimshianTurkishU.S. Virgin IslanderUgandanUkrainianUruguayanUteVenezuelanVietnameseWelshWest IndianYakamaYaquiYugoslavianYumanYup'ikZimbabwean
Immigration
NonimmigrantsImmigrantsAfghanistanAfricaAlbaniaArgentinaArmeniaAsiaAustraliaAustriaBahamasBangladeshBarbadosBelarusBelgiumBelizeBoliviaBosnia and HerzegovinaBrazilBulgariaBurma/MyanmarCabo VerdeCambodiaCameroonCanadaCaribbeanCentral AmericaChileChinaColombiaCongoCosta RicaCroatiaCubaCzechoslovakiaDenmarkDominicaDominican RepublicEastern AfricaEastern AsiaEastern EuropeEcuadorEgyptEl SalvadorEnglandEritreaEthiopiaEuropeFijiFranceGermanyGhanaGreeceGrenadaGuatemalaGuyanaHaitiHondurasHong KongHungaryIndiaIndonesiaIranIraqIrelandIsraelItalyJamaicaJapanJordanKazakhstanKenyaKoreaKuwaitLaosLatin AmericaLatviaLebanonLiberiaLithuaniaMalaysiaMexicoMicronesiaMiddle AfricaMoldovaMoroccoNepalNetherlandsNicaraguaNigeriaNorth AmericaNorth MacedoniaNorthern AfricaNorthern EuropeNorwayOceaniaPakistanPanamaPeruPhilippinesPolandPortugalRomaniaRussiaSaudi ArabiaScotlandSenegalSerbiaSierra LeoneSingaporeSomaliaSouth AfricaSouth AmericaSouth Central AsiaSouth Eastern AsiaSouthern EuropeSpainSri LankaSt. Vincent and the GrenadinesSudanSwedenSwitzerlandSyriaTaiwanThailandTrinidad and TobagoTurkeyUgandaUkraineUruguayUzbekistanVenezuelaVietnamWest IndiesWestern AfricaWestern AsiaWestern EuropeZaireZimbabweAzores
Unemployment Among Ages 30 to 34 years
Income
Poverty
Unemployment
Labor Participation
Family Structure
Vehicle Availability
Education Level
Disability

Unemployment Among Ages 30 to 34 years Comparison

Immigrants from Yemen

Serbians

Tragic
Good
7.3%
UNEMPLOYMENT AMONG AGES 30 TO 34 YEARS
0.0/ 100
METRIC RATING
323rd/ 347
METRIC RANK
5.4%
UNEMPLOYMENT AMONG AGES 30 TO 34 YEARS
72.9/ 100
METRIC RATING
138th/ 347
METRIC RANK

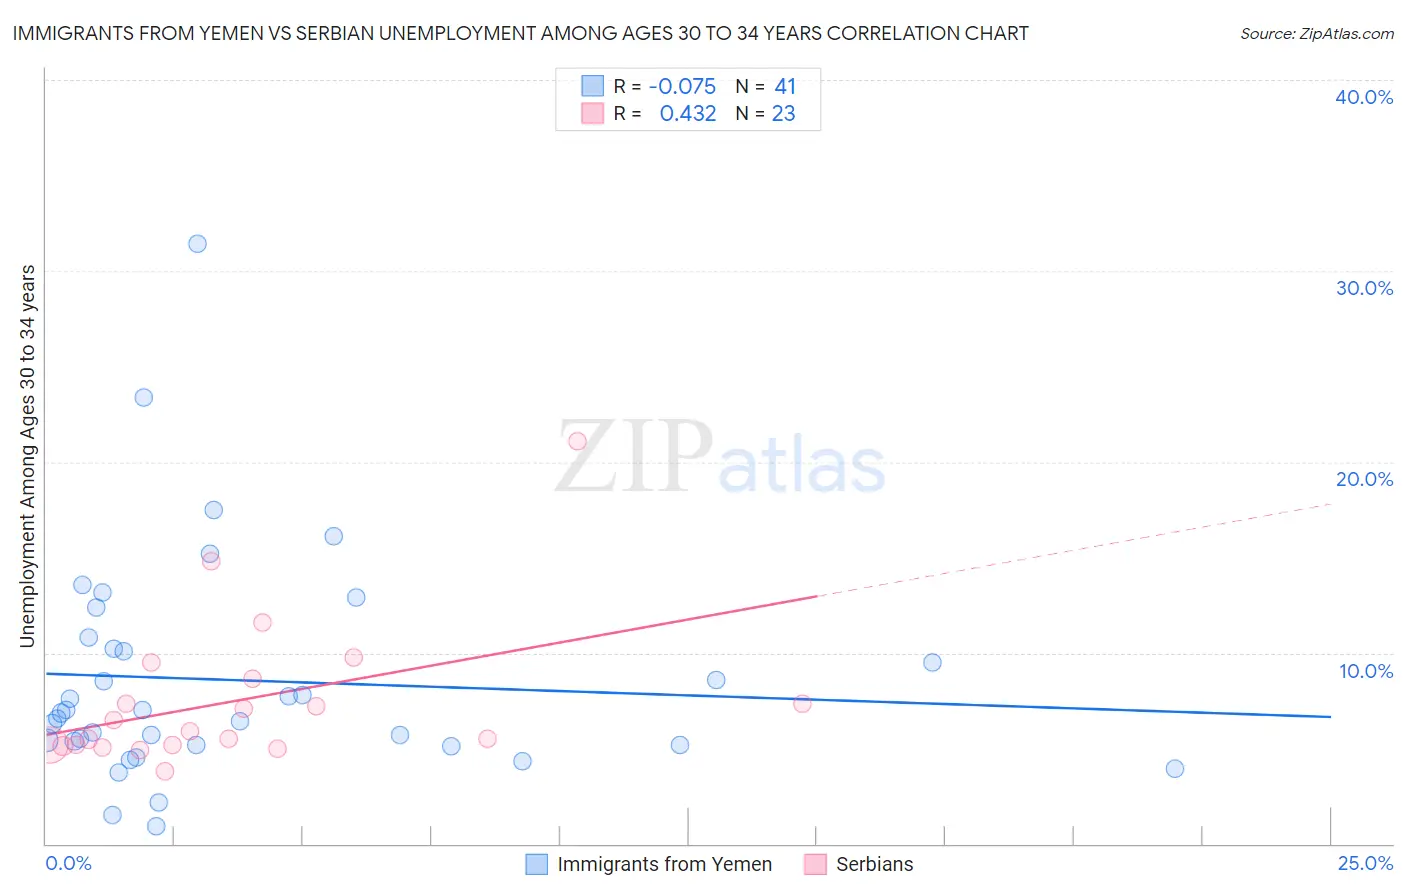
Immigrants from Yemen vs Serbian Unemployment Among Ages 30 to 34 years Correlation Chart

The statistical analysis conducted on geographies consisting of 81,630,994 people shows a slight negative correlation between the proportion of Immigrants from Yemen and unemployment rate among population between the ages 30 and 34 in the United States with a correlation coefficient (R) of -0.075 and weighted average of 7.3%. Similarly, the statistical analysis conducted on geographies consisting of 254,966,443 people shows a moderate positive correlation between the proportion of Serbians and unemployment rate among population between the ages 30 and 34 in the United States with a correlation coefficient (R) of 0.432 and weighted average of 5.4%, a difference of 35.6%.
Immigrants from Yemen vs Serbian Unemployment Among Ages 30 to 34 years

Unemployment Among Ages 30 to 34 years Correlation Summary

MeasurementImmigrants from YemenSerbian
Minimum0.90%3.8%
Maximum31.4%21.1%
Range30.5%17.3%
Mean8.6%7.5%
Median6.8%5.9%
Interquartile 25% (IQ1)5.2%5.2%
Interquartile 75% (IQ3)10.5%8.6%
Interquartile Range (IQR)5.3%3.5%
Standard Deviation (Sample)5.9%3.9%
Standard Deviation (Population)5.8%3.8%

Similar Demographics by Unemployment Among Ages 30 to 34 years

Demographics Similar to Immigrants from Yemen by Unemployment Among Ages 30 to 34 years

In terms of unemployment among ages 30 to 34 years, the demographic groups most similar to Immigrants from Yemen are Marshallese (7.2%, a difference of 0.46%), Immigrants from Dominica (7.3%, a difference of 0.59%), Apache (7.3%, a difference of 0.86%), Immigrants from Guyana (7.2%, a difference of 0.96%), and Cape Verdean (7.2%, a difference of 1.3%).
DemographicsRating | RankUnemployment Among Ages 30 to 34 years
Houma
0.0
/100
|
#316
Tragic
7.2%
Immigrants | Cabo Verde
0.0
/100
|
#317
Tragic
7.2%
Blacks/African Americans
0.0
/100
|
#318
Tragic
7.2%
Guyanese
0.0
/100
|
#319
Tragic
7.2%
Cape Verdeans
0.0
/100
|
#320
Tragic
7.2%
Immigrants | Guyana
0.0
/100
|
#321
Tragic
7.2%
Marshallese
0.0
/100
|
#322
Tragic
7.2%
Immigrants | Yemen
0.0
/100
|
#323
Tragic
7.3%
Immigrants | Dominica
0.0
/100
|
#324
Tragic
7.3%
Apache
0.0
/100
|
#325
Tragic
7.3%
Dominicans
0.0
/100
|
#326
Tragic
7.7%
Immigrants | Dominican Republic
0.0
/100
|
#327
Tragic
7.7%
Chippewa
0.0
/100
|
#328
Tragic
7.8%
Cheyenne
0.0
/100
|
#329
Tragic
7.8%
Shoshone
0.0
/100
|
#330
Tragic
7.9%

Demographics Similar to Serbians by Unemployment Among Ages 30 to 34 years

In terms of unemployment among ages 30 to 34 years, the demographic groups most similar to Serbians are Lithuanian (5.4%, a difference of 0.050%), Immigrants from North America (5.4%, a difference of 0.060%), Immigrants from Europe (5.4%, a difference of 0.080%), Immigrants from Greece (5.4%, a difference of 0.080%), and Immigrants from Canada (5.4%, a difference of 0.15%).
DemographicsRating | RankUnemployment Among Ages 30 to 34 years
Immigrants | Eastern Europe
77.4
/100
|
#131
Good
5.3%
Carpatho Rusyns
77.3
/100
|
#132
Good
5.3%
Immigrants | Northern Europe
77.3
/100
|
#133
Good
5.3%
Bangladeshis
76.6
/100
|
#134
Good
5.3%
Palestinians
75.1
/100
|
#135
Good
5.4%
Pakistanis
74.6
/100
|
#136
Good
5.4%
Immigrants | Canada
74.6
/100
|
#137
Good
5.4%
Serbians
72.9
/100
|
#138
Good
5.4%
Lithuanians
72.4
/100
|
#139
Good
5.4%
Immigrants | North America
72.2
/100
|
#140
Good
5.4%
Immigrants | Europe
72.1
/100
|
#141
Good
5.4%
Immigrants | Greece
72.0
/100
|
#142
Good
5.4%
Russians
71.1
/100
|
#143
Good
5.4%
Immigrants | Russia
71.0
/100
|
#144
Good
5.4%
Syrians
70.3
/100
|
#145
Good
5.4%